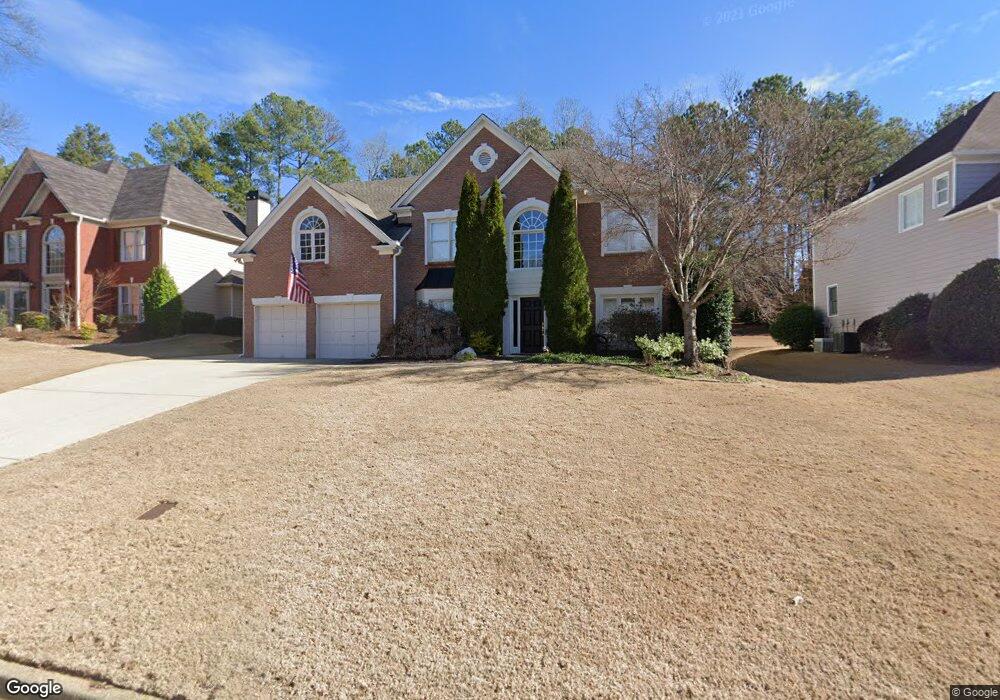
3993 Windgrove Crossing Unit 3 Suwanee, GA 30024
Estimated Value: $655,185 - $721,000
4
Beds
4
Baths
3,334
Sq Ft
$205/Sq Ft
Est. Value
About This Home
This home is located at 3993 Windgrove Crossing Unit 3, Suwanee, GA 30024 and is currently estimated at $683,796, approximately $205 per square foot. 3993 Windgrove Crossing Unit 3 is a home located in Gwinnett County with nearby schools including Suwanee Elementary School, North Gwinnett Middle School, and North Gwinnett High School.
Ownership History
Date
Name
Owned For
Owner Type
Purchase Details
Closed on
May 12, 2004
Sold by
Jeffrie Edward and Jeffrie Susan
Bought by
Davis Scott K and Davis Andrea
Current Estimated Value
Home Financials for this Owner
Home Financials are based on the most recent Mortgage that was taken out on this home.
Original Mortgage
$211,900
Outstanding Balance
$94,365
Interest Rate
5%
Mortgage Type
New Conventional
Estimated Equity
$589,431
Purchase Details
Closed on
Apr 24, 2003
Sold by
Jeffrie Edward and Jeffrie Susan
Bought by
State Farm Bk Fsb
Home Financials for this Owner
Home Financials are based on the most recent Mortgage that was taken out on this home.
Original Mortgage
$11,000
Interest Rate
5.86%
Mortgage Type
Stand Alone Second
Purchase Details
Closed on
Nov 12, 1999
Sold by
Peachtree Resid Props Inc
Bought by
Jeffrie Edward
Home Financials for this Owner
Home Financials are based on the most recent Mortgage that was taken out on this home.
Original Mortgage
$220,000
Interest Rate
6.75%
Mortgage Type
New Conventional
Create a Home Valuation Report for This Property
The Home Valuation Report is an in-depth analysis detailing your home's value as well as a comparison with similar homes in the area
Home Values in the Area
Average Home Value in this Area
Purchase History
| Date | Buyer | Sale Price | Title Company |
|---|---|---|---|
| Davis Scott K | $264,900 | -- | |
| State Farm Bk Fsb | -- | -- | |
| Jeffrie Edward | $231,600 | -- |
Source: Public Records
Mortgage History
| Date | Status | Borrower | Loan Amount |
|---|---|---|---|
| Open | Davis Scott K | $211,900 | |
| Previous Owner | State Farm Bk Fsb | $11,000 | |
| Previous Owner | Jeffrie Edward | $220,000 |
Source: Public Records
Tax History Compared to Growth
Tax History
| Year | Tax Paid | Tax Assessment Tax Assessment Total Assessment is a certain percentage of the fair market value that is determined by local assessors to be the total taxable value of land and additions on the property. | Land | Improvement |
|---|---|---|---|---|
| 2025 | $10,111 | $277,680 | $44,080 | $233,600 |
| 2024 | $9,055 | $244,640 | $47,200 | $197,440 |
| 2023 | $9,055 | $232,640 | $47,200 | $185,440 |
| 2022 | $7,928 | $213,560 | $40,400 | $173,160 |
| 2021 | $5,988 | $156,240 | $29,720 | $126,520 |
| 2020 | $5,728 | $148,080 | $27,640 | $120,440 |
| 2019 | $5,515 | $148,080 | $27,640 | $120,440 |
| 2018 | $5,242 | $140,000 | $32,000 | $108,000 |
| 2016 | $4,750 | $125,520 | $28,000 | $97,520 |
| 2015 | $4,235 | $109,480 | $21,200 | $88,280 |
| 2014 | $4,258 | $109,480 | $21,200 | $88,280 |
Source: Public Records
Map
Nearby Homes
- 358 Rhodes House Ct
- 3998 Oak Crossing Dr NE
- 3720 Brookefall Landing
- 3941 Oak Crossing Dr
- 4614 Austin Hills Dr
- 4394 Austin Hills Dr Unit 1
- 3713 Lake Edge Dr
- 407 Vista Lake Dr
- 3720 Crescent Walk Ln
- 3740 Crescent Walk Ln
- 4450 Woodward Walk Ln
- 3612 Brookefall Ct
- 4045 Hillcrest View Ct
- 4244 Austin Hills Dr
- 4154 Hawking Dr
- 4071 Woodward Walk Ln
- 4186 Terrace Oaks Ct
- 4217 Heisenberg Ln
- 4310 Woodward Walk Ln
- 4003 Windgrove Crossing Unit 3
- 3983 Windgrove Crossing Unit 3
- 0 Windgrove Crossing Unit 7279777
- 0 Windgrove Crossing Unit 7231986
- 0 Windgrove Crossing Unit 8574444
- 0 Windgrove Crossing
- 3963 Windgrove Crossing Unit 3
- 4013 Windgrove Crossing
- 3750 Old Suwanee Rd Unit 1
- 3740 Old Suwanee Rd
- 4008 Windgrove Crossing
- 3760 Old Suwanee Rd
- 3953 Windgrove Crossing
- 3730 Old Suwanee Rd
- 3978 Windgrove Crossing
- 4023 Windgrove Crossing
- 4018 Windgrove Crossing
- 3720 Old Suwanee Rd
- 3770 Old Suwanee Rd
- 4028 Windgrove Crossing