Estimated Value: $455,737 - $539,000
--
Bed
3
Baths
2,468
Sq Ft
$203/Sq Ft
Est. Value
About This Home
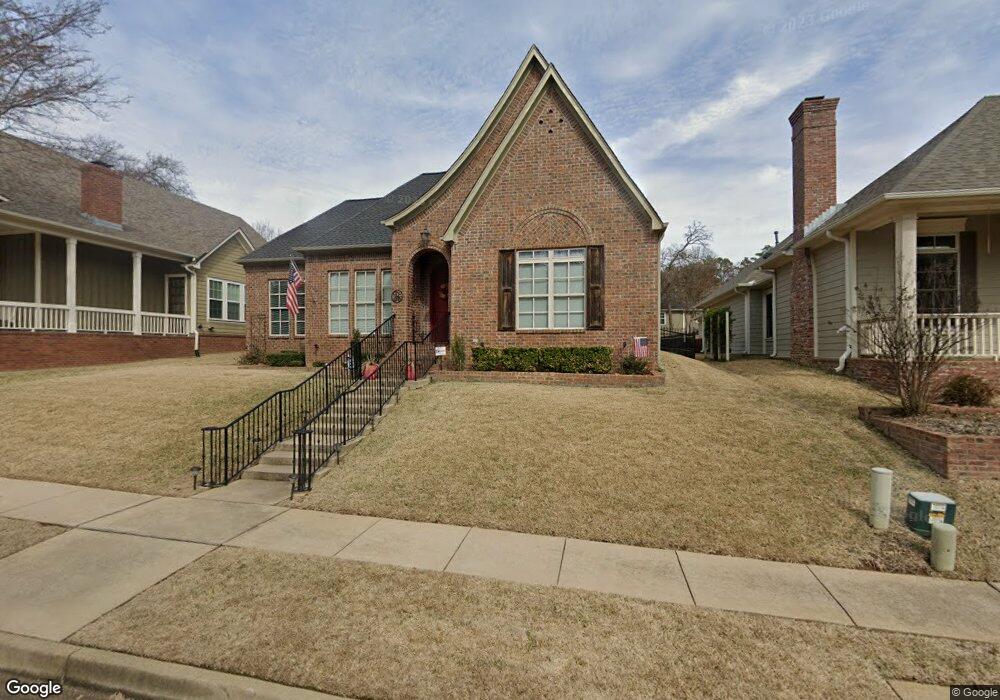
This home is located at 3994 Charleston Park, Tyler, TX 75701 and is currently estimated at $501,684, approximately $203 per square foot. 3994 Charleston Park is a home located in Smith County with nearby schools including Kissam Intermediate School, Jackson Elementary School, and Chapel Hill Middle School.
Ownership History
Date
Name
Owned For
Owner Type
Purchase Details
Closed on
Oct 6, 2017
Sold by
Carey Johan Adam and Carey Marissa Knauss
Bought by
Rains Charles and Rains Norma
Current Estimated Value
Purchase Details
Closed on
Mar 18, 2010
Sold by
Hsbc Bank Usa National Association
Bought by
Carey John Adam and Carey Marissa Knauss
Home Financials for this Owner
Home Financials are based on the most recent Mortgage that was taken out on this home.
Original Mortgage
$168,000
Interest Rate
4.88%
Mortgage Type
New Conventional
Purchase Details
Closed on
Nov 23, 2005
Sold by
Davidson James W and Davidson Christopher B
Bought by
Lowe Shonda
Home Financials for this Owner
Home Financials are based on the most recent Mortgage that was taken out on this home.
Original Mortgage
$61,200
Interest Rate
6.12%
Mortgage Type
Stand Alone Second
Create a Home Valuation Report for This Property
The Home Valuation Report is an in-depth analysis detailing your home's value as well as a comparison with similar homes in the area
Home Values in the Area
Average Home Value in this Area
Purchase History
| Date | Buyer | Sale Price | Title Company |
|---|---|---|---|
| Rains Charles | -- | None Available | |
| Carey John Adam | -- | Lsi Title Agency Inc | |
| Lowe Shonda | -- | None Available |
Source: Public Records
Mortgage History
| Date | Status | Borrower | Loan Amount |
|---|---|---|---|
| Previous Owner | Carey John Adam | $168,000 | |
| Previous Owner | Lowe Shonda | $61,200 | |
| Previous Owner | Lowe Shonda | $244,750 |
Source: Public Records
Tax History Compared to Growth
Tax History
| Year | Tax Paid | Tax Assessment Tax Assessment Total Assessment is a certain percentage of the fair market value that is determined by local assessors to be the total taxable value of land and additions on the property. | Land | Improvement |
|---|---|---|---|---|
| 2025 | $2,821 | $483,633 | $33,016 | $450,617 |
| 2024 | $2,821 | $415,003 | $43,200 | $455,389 |
| 2023 | $7,124 | $443,837 | $43,200 | $400,637 |
| 2022 | $6,175 | $342,977 | $43,200 | $299,777 |
| 2021 | $6,063 | $320,279 | $43,200 | $277,079 |
| 2020 | $5,894 | $302,153 | $43,200 | $258,953 |
| 2019 | $5,974 | $296,948 | $43,200 | $253,748 |
| 2018 | $5,632 | $281,624 | $36,000 | $245,624 |
| 2017 | $5,632 | $281,624 | $36,000 | $245,624 |
| 2016 | $5,424 | $271,208 | $36,000 | $235,208 |
| 2015 | $4,924 | $263,535 | $36,000 | $227,535 |
| 2014 | $4,924 | $259,020 | $36,000 | $223,020 |
Source: Public Records
Map
Nearby Homes
- 4021 Hanover Place
- 4025 Hanover Place
- 4029 Hanover Place
- 4024 Hanover Place
- 3962 Hanover Place
- 3950 Hanover Place
- 4037 Hanover Place
- 3913 Belle Mere St
- 2527 Westminster Dr
- 2613 Chelsea Dr
- 8226 County Road 219
- 8217 County Road 219
- 3606 Trailwood Ct
- 10130 State Highway 64 E
- 2216 Gish Ln
- 3618 Trailwood Ct
- 3858 Broadmoore Ct
- 3617 Flagstone Dr
- 3109 Campus Cir
- 3108 Williamsburg Cir
- 3994 3994 Charleston Park
- 3990 Charleston Park
- 4012 Charleston Park
- 3990 3990 Charleston Park
- 4016 Charleston Park
- 3986 Charleston Park
- 3997 Spartanburg
- 3993 Spartanburg
- 3993 3993 Spartanburg Ln
- 3989 Charleston Park
- 3989 3989 Charleston Park
- 3985 Charleston Park
- 3982 Charleston Park
- 4020 Charleston Park
- 3985 3985 Charleston Park
- 3989 Spartanburg
- 3989 3989 Spartanburg
- 3981 Charleston Park
- 4003 Spartanburg
- 2906 2906 Savannah Creek