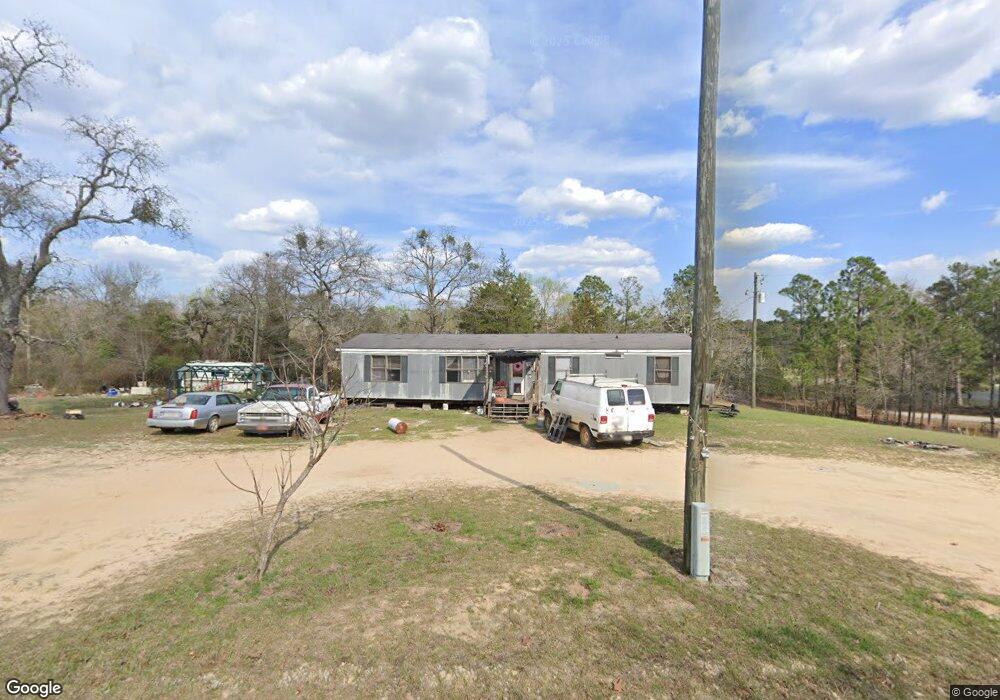
3994 Culberth Rd Dearing, GA 30808
Estimated Value: $62,218 - $155,000
Studio
--
Bath
1,440
Sq Ft
$79/Sq Ft
Est. Value
About This Home
This home is located at 3994 Culberth Rd, Dearing, GA 30808 and is currently estimated at $114,073, approximately $79 per square foot. 3994 Culberth Rd is a home with nearby schools including Thomson High School.
Ownership History
Date
Name
Owned For
Owner Type
Purchase Details
Closed on
Dec 1, 2020
Sold by
Clary Timothy
Bought by
Tuten Fred O
Current Estimated Value
Purchase Details
Closed on
Aug 25, 2015
Sold by
Clary Tonya
Bought by
Clary Timothy
Purchase Details
Closed on
Oct 5, 2007
Sold by
Tuten Fred O
Bought by
Clary Timothy and Clary Tonya
Home Financials for this Owner
Home Financials are based on the most recent Mortgage that was taken out on this home.
Original Mortgage
$50,000
Interest Rate
6.44%
Mortgage Type
New Conventional
Purchase Details
Closed on
Aug 17, 2006
Sold by
Bingham Necole
Bought by
Bingham Joseph E
Purchase Details
Closed on
Mar 13, 2006
Sold by
Tuten Donna M
Bought by
Bingham Joseph E
Purchase Details
Closed on
Feb 27, 2006
Sold by
Bingham Joseph E
Bought by
Bingham Necole M
Purchase Details
Closed on
Aug 2, 2000
Sold by
Tuten Donna
Bought by
Tuten Donna and Tuten Fred O
Purchase Details
Closed on
Mar 24, 2000
Sold by
Phillips Helen Fka Helen
Bought by
Tuten Donna
Create a Home Valuation Report for This Property
The Home Valuation Report is an in-depth analysis detailing your home's value as well as a comparison with similar homes in the area
Purchase History
| Date | Buyer | Sale Price | Title Company |
|---|---|---|---|
| Tuten Fred O | -- | -- | |
| Clary Timothy | -- | -- | |
| Clary Timothy | $50,000 | -- | |
| Bingham Joseph E | -- | -- | |
| Bingham Joseph E | $76,800 | -- | |
| Bingham Necole M | -- | -- | |
| Tuten Donna | -- | -- | |
| Tuten Donna | -- | -- |
Source: Public Records
Mortgage History
| Date | Status | Borrower | Loan Amount |
|---|---|---|---|
| Previous Owner | Clary Timothy | $50,000 |
Source: Public Records
Tax History
| Year | Tax Paid | Tax Assessment Tax Assessment Total Assessment is a certain percentage of the fair market value that is determined by local assessors to be the total taxable value of land and additions on the property. | Land | Improvement |
|---|---|---|---|---|
| 2025 | $168 | $3,740 | $2,740 | $1,000 |
| 2024 | $165 | $3,468 | $2,468 | $1,000 |
| 2023 | $170 | $3,468 | $2,468 | $1,000 |
| 2022 | $170 | $3,468 | $2,468 | $1,000 |
| 2021 | $141 | $3,396 | $2,396 | $1,000 |
| 2020 | $267 | $13,478 | $5,182 | $8,296 |
| 2019 | $269 | $13,441 | $5,182 | $8,259 |
| 2018 | $268 | $13,394 | $5,182 | $8,212 |
| 2017 | $253 | $13,211 | $5,182 | $8,029 |
| 2016 | $326 | $12,996 | $5,182 | $7,814 |
| 2015 | -- | $15,002 | $7,386 | $7,616 |
| 2014 | -- | $16,233 | $7,386 | $8,846 |
| 2013 | -- | $0 | $0 | $0 |
Source: Public Records
Map
Nearby Homes
- 4327 Fish Hatchery Rd
- 3553 Gant Jackson Rd
- 3619,3627, Bethany Ct
- 0 Mitchner Rd Unit 548843
- 0 Whitaker Rd Unit 540660
- 3786 Wire Rd
- 3796 Wire Rd
- 290 Neals Mill Rd
- 3191 Old Augusta Rd
- 3175 Old Augusta Rd
- 2135 Rd
- 2111 Fort Creek Rd
- 5861 Luckeys Bridge Rd
- 4095 Wildwood Dr
- 789 George McDuffie Rd
- 5829 Augusta Hwy SE
- 1463 Lokey Dr
- 840 Sweet Grass Cir
- 852 Sweet Grass Cir
- 833 Sweet Grass Cir
- 4364 Fish Hatchery Rd
- 3985 Culberth Rd
- 4263 Fish Hatchery Rd
- 3961 Culberth Rd
- 4241 Fish Hatchery Rd
- 3944 Culberth Rd
- 3889 Culberth Rd
- 4189 Fish Hatchery Rd
- 3909 Culberth Rd
- 4163 Fish Hatchery Rd
- 4160 Fish Hatchery Rd
- 4132 Fish Hatchery Rd
- 4103 Fish Hatchery Rd
- 3953 Culberth Rd
- 3795 Culberth Rd
- 4078 Fish Hatchery Rd
- 3768 Ellington Airline Rd
- 3668 Ellington Airline Rd
- 3804 Ellington Airline Rd
- 4064 Fish Hatchery Rd
Your Personal Tour Guide
Ask me questions while you tour the home.