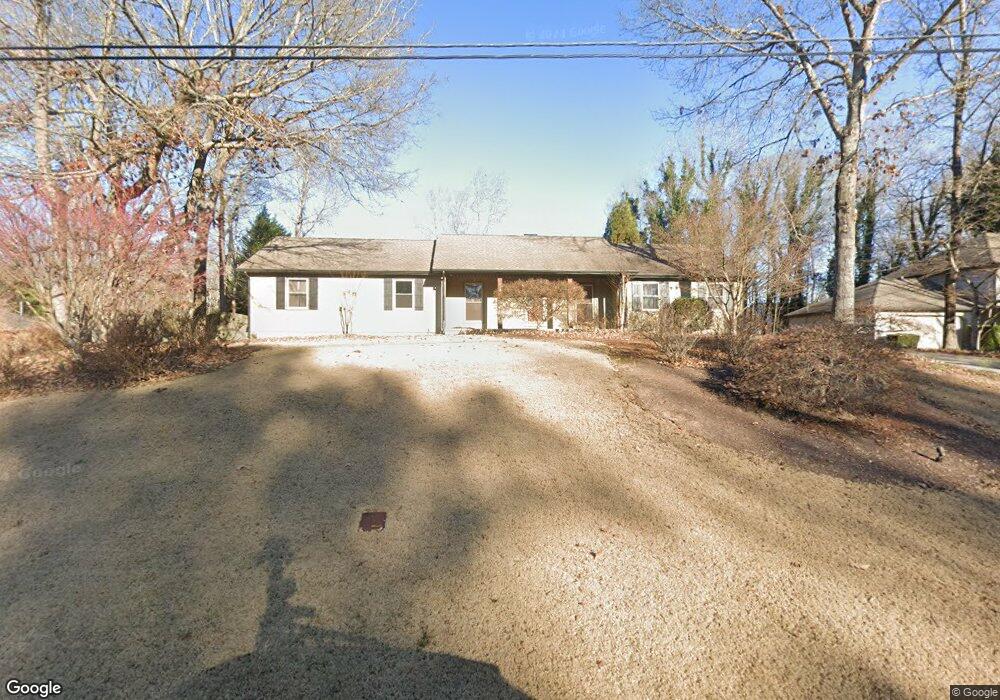
3995 Hidden Oak Ln Buford, GA 30519
Estimated Value: $330,000 - $405,000
2
Beds
2
Baths
1,610
Sq Ft
$235/Sq Ft
Est. Value
About This Home
This home is located at 3995 Hidden Oak Ln, Buford, GA 30519 and is currently estimated at $378,386, approximately $235 per square foot. 3995 Hidden Oak Ln is a home located in Gwinnett County with nearby schools including Harmony Elementary School and Glenn C. Jones Middle School.
Ownership History
Date
Name
Owned For
Owner Type
Purchase Details
Closed on
Nov 5, 2018
Sold by
Clancy Timothy
Bought by
Clancy William S
Current Estimated Value
Home Financials for this Owner
Home Financials are based on the most recent Mortgage that was taken out on this home.
Original Mortgage
$216,015
Outstanding Balance
$125,206
Interest Rate
4.4%
Mortgage Type
FHA
Estimated Equity
$253,180
Purchase Details
Closed on
Jul 25, 2017
Sold by
Shupe Christopher
Bought by
Clancy Timothy
Home Financials for this Owner
Home Financials are based on the most recent Mortgage that was taken out on this home.
Original Mortgage
$184,500
Interest Rate
3.88%
Mortgage Type
New Conventional
Purchase Details
Closed on
Feb 28, 2006
Sold by
Casey David W
Bought by
Shupe Christopher
Purchase Details
Closed on
Mar 24, 1997
Sold by
Harris Robert L Dee Ann
Bought by
Casey Patricia H
Create a Home Valuation Report for This Property
The Home Valuation Report is an in-depth analysis detailing your home's value as well as a comparison with similar homes in the area
Home Values in the Area
Average Home Value in this Area
Purchase History
| Date | Buyer | Sale Price | Title Company |
|---|---|---|---|
| Clancy William S | $220,000 | -- | |
| Clancy Timothy | $205,000 | -- | |
| Shupe Christopher | $149,500 | -- | |
| Casey Patricia H | $112,000 | -- |
Source: Public Records
Mortgage History
| Date | Status | Borrower | Loan Amount |
|---|---|---|---|
| Open | Clancy William S | $216,015 | |
| Previous Owner | Clancy Timothy | $184,500 | |
| Closed | Casey Patricia H | $0 |
Source: Public Records
Tax History Compared to Growth
Tax History
| Year | Tax Paid | Tax Assessment Tax Assessment Total Assessment is a certain percentage of the fair market value that is determined by local assessors to be the total taxable value of land and additions on the property. | Land | Improvement |
|---|---|---|---|---|
| 2025 | $4,106 | $136,400 | $32,800 | $103,600 |
| 2024 | $3,857 | $119,040 | $26,000 | $93,040 |
| 2023 | $3,857 | $106,760 | $22,400 | $84,360 |
| 2022 | $3,565 | $106,760 | $22,400 | $84,360 |
| 2021 | $3,100 | $82,640 | $17,280 | $65,360 |
| 2020 | $3,118 | $82,640 | $17,280 | $65,360 |
| 2019 | $3,126 | $78,080 | $16,000 | $62,080 |
| 2018 | $3,126 | $78,080 | $16,000 | $62,080 |
| 2016 | $2,345 | $61,160 | $11,200 | $49,960 |
| 2015 | $2,380 | $61,160 | $11,200 | $49,960 |
| 2014 | $2,392 | $61,160 | $11,200 | $49,960 |
Source: Public Records
Map
Nearby Homes
- 3170 Tallulah Dr
- 2997 Springlake Dr
- 2997 Spring Lake Dr
- 3606 Andover Way
- 3075 Andover Trail
- 3421 Andover Way
- 3210 Golden Spring Dr Unit 1
- 3200 Golden Spring Dr
- 3939 Bessemer Dr Unit 2
- 3345 Stoneleigh Run Dr
- 3236 Copper Creek Ln NE
- 3026 Sea Aster Way
- 3016 Sea Aster Way
- 4375 Easter Lily Ave
- 3125 Bart Johnson Rd
- 2810 Promenade Place
- 3340 Ivey Ridge Rd
- 4304 Grey Park Dr
- 0 Amicalola Way Unit 8642796
- 0 Amicalola Way Unit 8607187
- 0 Amicalola Way Unit 9036252
- 0 Amicalola Way Unit 8796177
- 0 Amicalola Way Unit 7138812
- 0 Amicalola Way Unit 7173452
- 0 Amicalola Way Unit 7243585
- 0 Amicalola Way Unit 7439971
- 0 Amicalola Way Unit 7439944
- 0 Amicalola Way Unit 7441031
- 0 Amicalola Way
- 3985 Hidden Oak Ln
- 4005 Hidden Oak Ln
- 4086 Amicalola Way
- 4076 Amicalola Way
- 3975 Hidden Oak Ln
- 3990 Hidden Oak Ln Unit 1
- 4066 Amicalola Way
- 4096 Amicalola Way
- 4000 Hidden Oak Ln Unit 1