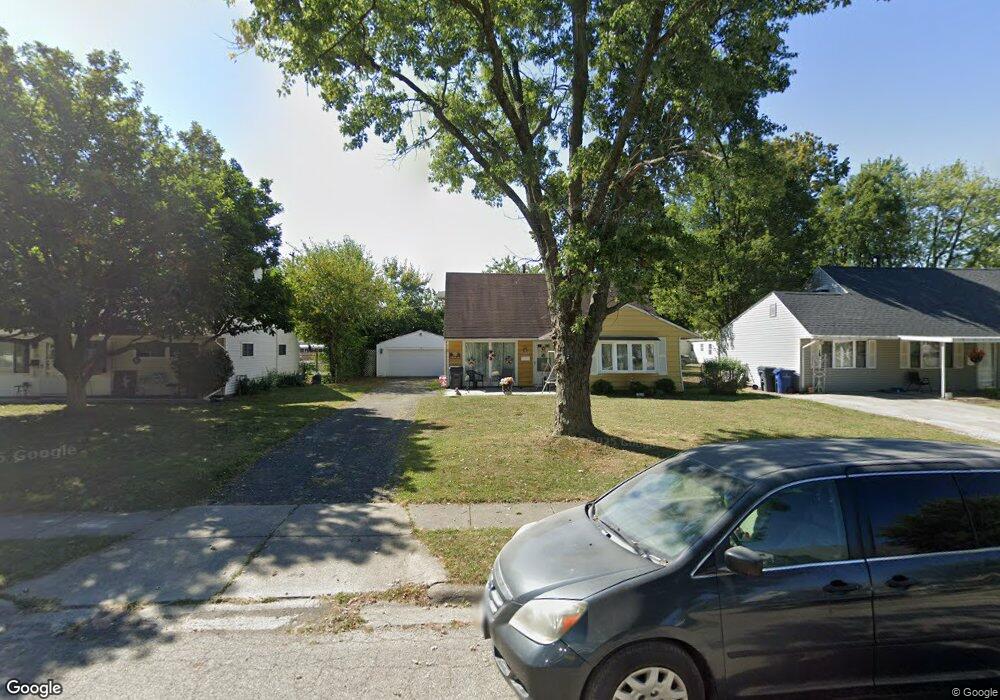
3995 Virginia Cir E Columbus, OH 43213
Estimated Value: $152,000 - $225,000
4
Beds
1
Bath
1,375
Sq Ft
$147/Sq Ft
Est. Value
About This Home
This home is located at 3995 Virginia Cir E, Columbus, OH 43213 and is currently estimated at $201,466, approximately $146 per square foot. 3995 Virginia Cir E is a home located in Franklin County with nearby schools including Beechwood Elementary School, Etna Road Elementary School, and Rosemore Middle School.
Ownership History
Date
Name
Owned For
Owner Type
Purchase Details
Closed on
Aug 7, 2017
Sold by
U S Bank N A
Bought by
Wwsd Llc
Current Estimated Value
Purchase Details
Closed on
Mar 9, 2017
Sold by
Hatfield Jack R
Bought by
Nationklasscotuion Uysbank
Purchase Details
Closed on
Dec 2, 2016
Sold by
Hatfield Jack R
Bought by
Us Bank Na
Purchase Details
Closed on
Apr 10, 2009
Sold by
Wagner Mark Anthony and Clark James Eugene
Bought by
Hatfield Jack R
Home Financials for this Owner
Home Financials are based on the most recent Mortgage that was taken out on this home.
Original Mortgage
$82,468
Interest Rate
5.11%
Mortgage Type
FHA
Purchase Details
Closed on
Dec 14, 2007
Sold by
Estate Of Carl Eugene Clark
Bought by
Clark Donna Lou
Purchase Details
Closed on
Feb 2, 1976
Bought by
Clark Carl E
Create a Home Valuation Report for This Property
The Home Valuation Report is an in-depth analysis detailing your home's value as well as a comparison with similar homes in the area
Home Values in the Area
Average Home Value in this Area
Purchase History
| Date | Buyer | Sale Price | Title Company |
|---|---|---|---|
| Wwsd Llc | $71,000 | Independent Title Svcs Inc | |
| Nationklasscotuion Uysbank | $83,500 | None Available | |
| Us Bank Na | $83,430 | None Available | |
| Hatfield Jack R | $84,000 | Arrow Tit | |
| Clark Donna Lou | -- | Arrow Title | |
| Clark Carl E | -- | -- |
Source: Public Records
Mortgage History
| Date | Status | Borrower | Loan Amount |
|---|---|---|---|
| Previous Owner | Hatfield Jack R | $82,468 |
Source: Public Records
Tax History
| Year | Tax Paid | Tax Assessment Tax Assessment Total Assessment is a certain percentage of the fair market value that is determined by local assessors to be the total taxable value of land and additions on the property. | Land | Improvement |
|---|---|---|---|---|
| 2025 | $2,363 | $52,790 | $18,870 | $33,920 |
| 2024 | $2,363 | $52,790 | $18,870 | $33,920 |
| 2023 | $2,347 | $52,780 | $18,865 | $33,915 |
| 2022 | $1,819 | $31,090 | $6,760 | $24,330 |
| 2021 | $1,711 | $31,090 | $6,760 | $24,330 |
| 2020 | $1,694 | $31,090 | $6,760 | $24,330 |
| 2019 | $1,558 | $24,850 | $5,390 | $19,460 |
| 2018 | $1,513 | $24,850 | $5,390 | $19,460 |
| 2017 | $955 | $25,240 | $5,390 | $19,850 |
| 2016 | $1,950 | $21,840 | $6,020 | $15,820 |
| 2015 | $1,439 | $21,840 | $6,020 | $15,820 |
| 2014 | $1,439 | $21,840 | $6,020 | $15,820 |
| 2013 | $760 | $24,255 | $6,685 | $17,570 |
Source: Public Records
Map
Nearby Homes
- 4174 Wright Park
- 4212 Seigman Ave
- 4105 Elbern Ave
- 4117 Elbern Ave
- 4148 Elbern Ave
- 798 S Yearling Rd
- 695 Erickson Ave
- 3840 Elbern Ave
- 320 Collingwood Ave
- 3814 Elbern Ave
- 745 Pierce Ave
- 957 Rose Place
- 558 Maplewood Ave
- 491 Westphal Ave
- 1001 Beechwood Rd
- 963 Erickson Ave
- 3857 Doney St
- 1035 E Fulton St
- 4413 Broadhurst Dr
- 931 E Fulton St
- 4001 Virginia Cir E
- 3985 Virginia Cir E
- 4009 Virginia Cir E
- 3975 Virginia Cir E
- 592 Beechwood Rd
- 600 Beechwood Rd
- 4015 Virginia Cir E
- 3994 Virginia Cir E
- 4000 Virginia Cir E
- 3986 Virginia Cir E
- 4006 Virginia Cir E
- 550 Beechwood Rd
- 4012 Virginia Cir E
- 4025 Virginia Cir E
- 4020 Virginia Cir E
- 567 Virginia Cir W
- 616 Beechwood Rd
- 4026 Virginia Cir E
- 4026 Virginia Cir E Unit E
- 4033 Virginia Cir E
Your Personal Tour Guide
Ask me questions while you tour the home.