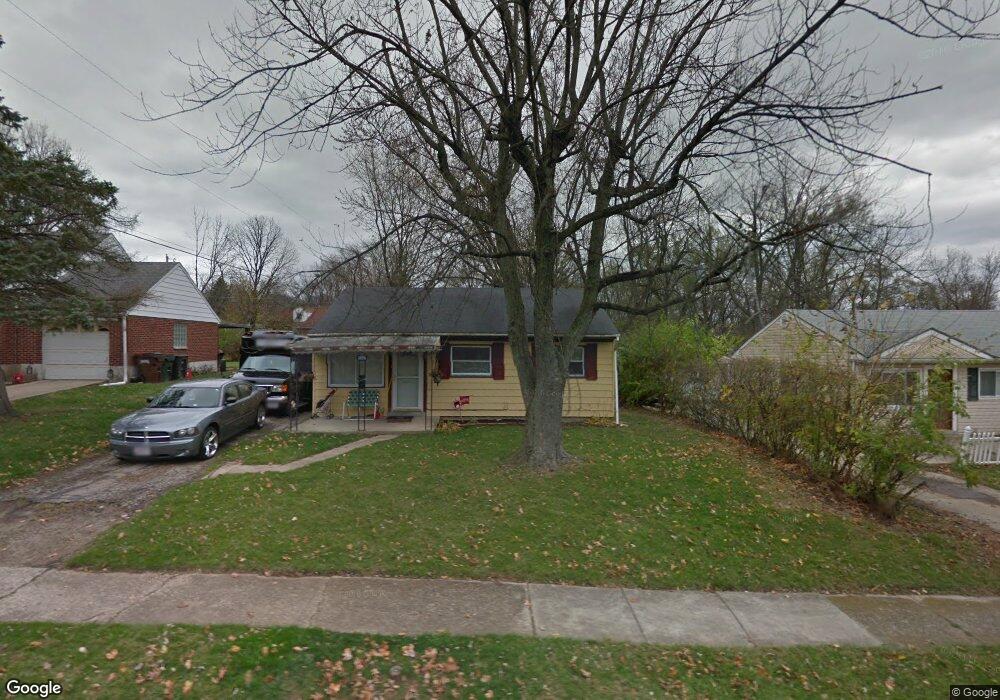
3996 Mayview Dr Dayton, OH 45416
Estimated Value: $84,553 - $110,000
3
Beds
1
Bath
884
Sq Ft
$113/Sq Ft
Est. Value
About This Home
This home is located at 3996 Mayview Dr, Dayton, OH 45416 and is currently estimated at $99,638, approximately $112 per square foot. 3996 Mayview Dr is a home located in Montgomery County with nearby schools including Valerie Elementary School, North Dayton School of Science & Discovery, and Imagine Klepinger Road Community School.
Ownership History
Date
Name
Owned For
Owner Type
Purchase Details
Closed on
Nov 7, 2013
Sold by
Federal Home Loan Mortgage Corporation
Bought by
Stargell Christopher E and Edwards Keaplish D
Current Estimated Value
Purchase Details
Closed on
Jul 29, 2013
Sold by
Baker Jeffrey L and Baker Jeff
Bought by
Federal Home Loan Mortgage Corporation
Purchase Details
Closed on
Jun 18, 2013
Sold by
Baker Jeffrey L and Cenlar Fsb
Bought by
Federal Home Loan Mortgage Corporation
Purchase Details
Closed on
Mar 24, 1998
Sold by
Hanssen Roger Fred and Hanssen Phyllis D
Bought by
Baker Jeffrey L and Baker Pamela S
Home Financials for this Owner
Home Financials are based on the most recent Mortgage that was taken out on this home.
Original Mortgage
$27,000
Interest Rate
7.15%
Create a Home Valuation Report for This Property
The Home Valuation Report is an in-depth analysis detailing your home's value as well as a comparison with similar homes in the area
Home Values in the Area
Average Home Value in this Area
Purchase History
| Date | Buyer | Sale Price | Title Company |
|---|---|---|---|
| Stargell Christopher E | -- | None Available | |
| Federal Home Loan Mortgage Corporation | $18,000 | None Available | |
| Federal Home Loan Mortgage Corporation | $18,000 | None Available | |
| Baker Jeffrey L | $27,000 | Tower City Title Agency Inc | |
| Baker Jeffrey L | $27,000 | -- |
Source: Public Records
Mortgage History
| Date | Status | Borrower | Loan Amount |
|---|---|---|---|
| Previous Owner | Baker Jeffrey L | $27,000 |
Source: Public Records
Tax History Compared to Growth
Tax History
| Year | Tax Paid | Tax Assessment Tax Assessment Total Assessment is a certain percentage of the fair market value that is determined by local assessors to be the total taxable value of land and additions on the property. | Land | Improvement |
|---|---|---|---|---|
| 2024 | $1,088 | $12,800 | $3,400 | $9,400 |
| 2023 | $1,088 | $12,800 | $3,400 | $9,400 |
| 2022 | $1,211 | $10,820 | $2,880 | $7,940 |
| 2021 | $1,203 | $10,820 | $2,880 | $7,940 |
| 2020 | $1,131 | $10,820 | $2,880 | $7,940 |
| 2019 | $1,228 | $10,060 | $2,880 | $7,180 |
| 2018 | $1,227 | $10,060 | $2,880 | $7,180 |
| 2017 | $1,083 | $10,060 | $2,880 | $7,180 |
| 2016 | $1,126 | $10,060 | $2,880 | $7,180 |
| 2015 | $999 | $10,060 | $2,880 | $7,180 |
| 2014 | $999 | $10,060 | $2,880 | $7,180 |
| 2012 | -- | $12,850 | $3,860 | $8,990 |
Source: Public Records
Map
Nearby Homes
- 4703 Natchez Ave
- 4616 Channing Ln
- 4322 Annapolis Ave
- 4472 Curundu Ave
- 4104 Brenton Dr
- 4237 Nevada Ave
- 3709 Mandalay Dr
- 4534 Fairgreen Dr
- 4534 N Fairgreen Ave
- 4831 Free Pike
- 4235 Merryfield Ave
- 3462 Arlene Ave
- 4228 Molane St
- 4131 Merryfield Ave
- 3678 Wilmore St
- 5224 Heatherton Dr
- 5719 Denlinger Rd
- 4431 Wolf Rd
- Lot#14 Bridgeport Dr
- Lot#15 Bridgeport Dr
- 3990 Mayview Dr
- 4002 Mayview Dr
- 3984 Mayview Dr
- 4010 Mayview Dr
- 3997 Myron Ave
- 3991 Myron Ave
- 4003 Myron Ave
- 3978 Mayview Dr
- 4016 Mayview Dr
- 3985 Myron Ave
- 3997 Mayview Dr
- 3991 Mayview Dr
- 4009 Myron Ave
- 4003 Mayview Dr
- 4009 Mayview Dr
- 4551 Natchez Ave
- 4022 Mayview Dr
- 4571 Natchez Ave
- 3979 Mayview Dr
- 4015 Mayview Dr