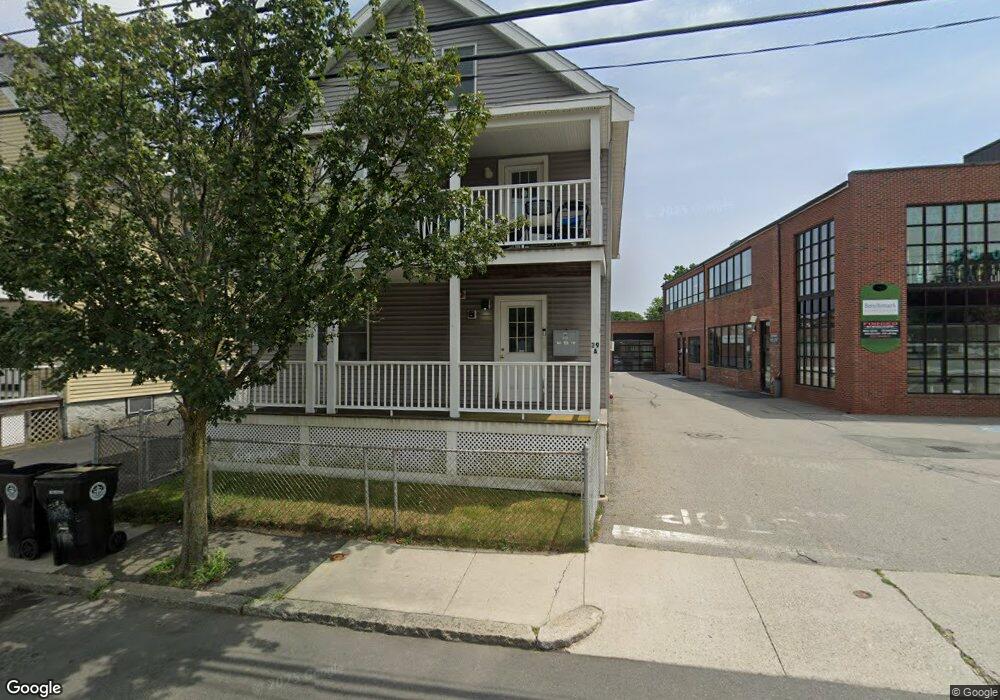
39A Mason St Salem, MA 01970
North Salem NeighborhoodEstimated Value: $734,440 - $968,000
9
Beds
4
Baths
3,476
Sq Ft
$248/Sq Ft
Est. Value
About This Home
This home is located at 39A Mason St, Salem, MA 01970 and is currently estimated at $861,610, approximately $247 per square foot. 39A Mason St is a home located in Essex County with nearby schools including Bates Elementary School, Saltonstall School, and Carlton Elementary School.
Ownership History
Date
Name
Owned For
Owner Type
Purchase Details
Closed on
Nov 7, 2005
Sold by
Andrus Albin A
Bought by
Haley Stephen W
Current Estimated Value
Home Financials for this Owner
Home Financials are based on the most recent Mortgage that was taken out on this home.
Original Mortgage
$285,000
Outstanding Balance
$154,338
Interest Rate
5.85%
Mortgage Type
Commercial
Estimated Equity
$707,272
Create a Home Valuation Report for This Property
The Home Valuation Report is an in-depth analysis detailing your home's value as well as a comparison with similar homes in the area
Home Values in the Area
Average Home Value in this Area
Purchase History
| Date | Buyer | Sale Price | Title Company |
|---|---|---|---|
| Haley Stephen W | $380,000 | -- |
Source: Public Records
Mortgage History
| Date | Status | Borrower | Loan Amount |
|---|---|---|---|
| Open | Haley Stephen W | $285,000 |
Source: Public Records
Tax History Compared to Growth
Tax History
| Year | Tax Paid | Tax Assessment Tax Assessment Total Assessment is a certain percentage of the fair market value that is determined by local assessors to be the total taxable value of land and additions on the property. | Land | Improvement |
|---|---|---|---|---|
| 2025 | $10,538 | $929,300 | $170,100 | $759,200 |
| 2024 | $9,817 | $844,800 | $170,100 | $674,700 |
| 2023 | $9,593 | $766,800 | $155,600 | $611,200 |
| 2022 | $9,230 | $696,600 | $149,900 | $546,700 |
| 2021 | $8,884 | $643,800 | $141,200 | $502,600 |
| 2020 | $8,212 | $568,300 | $126,800 | $441,500 |
| 2019 | $6,544 | $433,400 | $115,300 | $318,100 |
| 2018 | $5,791 | $376,500 | $107,200 | $269,300 |
| 2017 | $5,718 | $360,500 | $100,900 | $259,600 |
| 2016 | $5,226 | $333,500 | $81,900 | $251,600 |
| 2015 | $5,327 | $324,600 | $81,900 | $242,700 |
Source: Public Records
Map
Nearby Homes
- 3 S Mason St
- 112 North St
- 78 Federal St
- 97 Mason St Unit 2
- 145 Federal St Unit 3
- 8 Upham St
- 35 Flint St Unit 209
- 35 Flint St Unit 106
- 304 Essex St Unit 1
- 18 Franklin St Unit 303
- 47 Federal St
- 38 Chestnut St
- 289 Essex St Unit 307
- 11 Summer St
- 15 Lynde St Unit 26
- 281 Essex St Unit 201
- 0 Lot 41 Map 10 Unit 73335079
- 0 Lot 61 Map 10 Unit 73335091
- 27 Appleton St
- 36 Irving St Unit B
- 39 Mason St
- 37 Mason St Unit 3
- 37 Mason St Unit 2
- 41 Mason St Unit 6
- 41 Mason St Unit 5
- 41 Mason St Unit 1
- 41 Mason St Unit 3
- 41 Mason St Unit 4
- 41 Mason St
- 44 Mason St
- 2 Dunlap St
- 42 Mason St
- 35 Mason St
- 36 Mason St Unit 38
- 48 Mason St Unit 50
- 48-50 Mason St
- 4 Dunlap St
- 45 Mason St Unit 4
- 45 Mason St
- 1 Dunlap St