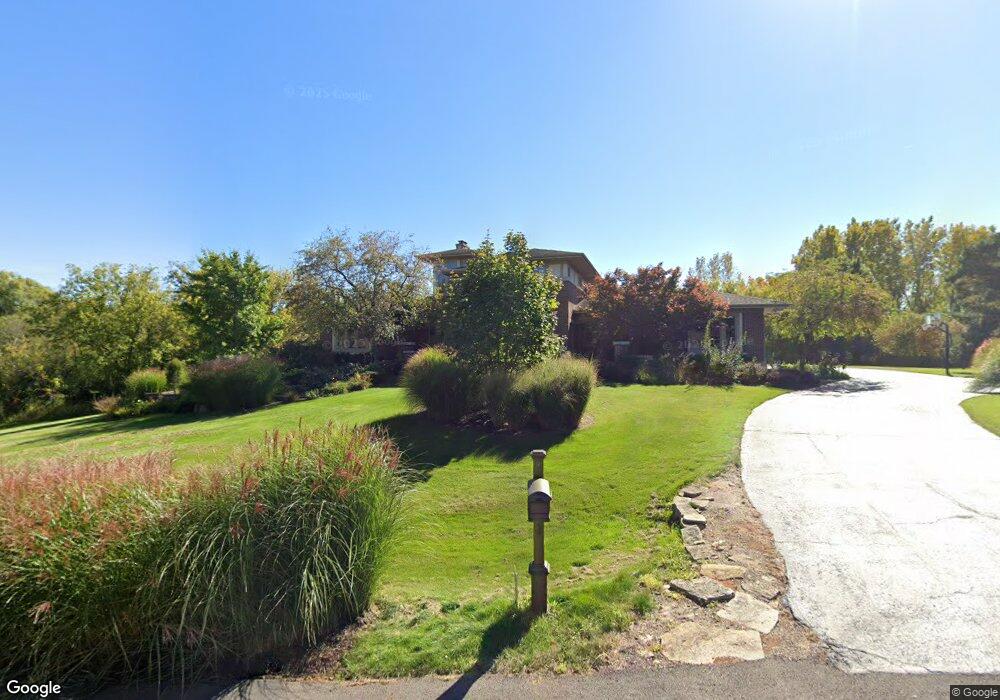
39W943 Crosscreek Ln Unit 7 Saint Charles, IL 60175
Estimated Value: $1,053,066 - $1,378,000
4
Beds
4
Baths
4,010
Sq Ft
$295/Sq Ft
Est. Value
About This Home
This home is located at 39W943 Crosscreek Ln Unit 7, Saint Charles, IL 60175 and is currently estimated at $1,182,355, approximately $294 per square foot. 39W943 Crosscreek Ln Unit 7 is a home located in Kane County with nearby schools including Ferson Creek Elementary School, Thompson Middle School, and St Charles North High School.
Ownership History
Date
Name
Owned For
Owner Type
Purchase Details
Closed on
May 27, 2004
Sold by
Cash Steven A and Cash Holly M
Bought by
Kmiecik Joseph and Kmiecik Joan
Current Estimated Value
Home Financials for this Owner
Home Financials are based on the most recent Mortgage that was taken out on this home.
Original Mortgage
$650,000
Outstanding Balance
$301,658
Interest Rate
5.25%
Mortgage Type
Purchase Money Mortgage
Estimated Equity
$880,697
Purchase Details
Closed on
Oct 11, 2001
Sold by
Didier Builders Usa Inc
Bought by
Cash Steven A and Cash Holly M
Home Financials for this Owner
Home Financials are based on the most recent Mortgage that was taken out on this home.
Original Mortgage
$740,000
Interest Rate
6.62%
Purchase Details
Closed on
Oct 9, 2001
Sold by
Development Properties Inc
Bought by
Didier Builders Usa Inc
Home Financials for this Owner
Home Financials are based on the most recent Mortgage that was taken out on this home.
Original Mortgage
$740,000
Interest Rate
6.62%
Create a Home Valuation Report for This Property
The Home Valuation Report is an in-depth analysis detailing your home's value as well as a comparison with similar homes in the area
Home Values in the Area
Average Home Value in this Area
Purchase History
| Date | Buyer | Sale Price | Title Company |
|---|---|---|---|
| Kmiecik Joseph | $940,000 | Chicago Title Insurance Comp | |
| Cash Steven A | $925,000 | Chicago Title Insurance Co | |
| Didier Builders Usa Inc | $158,000 | Chicago Title Insurance Co |
Source: Public Records
Mortgage History
| Date | Status | Borrower | Loan Amount |
|---|---|---|---|
| Open | Kmiecik Joseph | $650,000 | |
| Previous Owner | Cash Steven A | $740,000 | |
| Closed | Kmiecik Joseph | $102,000 |
Source: Public Records
Tax History Compared to Growth
Tax History
| Year | Tax Paid | Tax Assessment Tax Assessment Total Assessment is a certain percentage of the fair market value that is determined by local assessors to be the total taxable value of land and additions on the property. | Land | Improvement |
|---|---|---|---|---|
| 2024 | $24,266 | $375,127 | $53,696 | $321,431 |
| 2023 | $23,785 | $335,384 | $48,007 | $287,377 |
| 2022 | $22,470 | $305,589 | $43,742 | $261,847 |
| 2021 | $21,141 | $288,536 | $41,301 | $247,235 |
| 2020 | $21,115 | $284,384 | $40,707 | $243,677 |
| 2019 | $20,858 | $280,209 | $40,109 | $240,100 |
| 2018 | $20,828 | $280,209 | $40,109 | $240,100 |
| 2017 | $20,651 | $276,095 | $39,520 | $236,575 |
| 2016 | $21,969 | $269,124 | $38,522 | $230,602 |
| 2015 | -- | $261,692 | $37,458 | $224,234 |
| 2014 | -- | $265,704 | $38,032 | $227,672 |
| 2013 | -- | $270,162 | $38,670 | $231,492 |
Source: Public Records
Map
Nearby Homes
- 39W841 Prunetree Ln
- 40W630 Winchester Way
- 40W035 Deer Run Dr
- 5N648 Farrier Point Ln
- 7N075 Hastings Dr
- 7N107 Hastings Dr
- 7N108 Hastings Dr
- 39W795 Goldenrod Dr
- 39W162 Longmeadow Ln
- 5N155 Prairie Rose Dr
- 40W897 Brown Rd
- 39W002 Bolcum Rd
- 6N729 Old Homestead Rd
- 7N072 Willowbrook Dr
- 42W690 Illinois 64
- 1857 Chandolin Ln
- 4N550 School Rd
- 1865 Chandolin Ln
- 1863 Chandolin Ln
- 1867 Chandolin Ln
- 39W973 Crosscreek Ln
- 39W940 Crosscreek Ln
- 39W970 Crosscreek Ln Unit 7
- 39W863 Crosscreek Ln Unit 5
- 39W860 Crosscreek Ln
- 39W833 Crosscreek Ln
- 39W836 Crosscreek Ln Unit 5
- 39W809 Crosscreek Ln
- 39W750 Crosscreek Ln
- 6N184 Old Farm Ln
- 6N200 Old Farm Ln
- 39W775 Crosscreek Ln
- 39W784 Deerhaven Trail
- 39W746 Crosscreek Ln Unit 5
- 6N179 Old Farm Ln
- 39W793 Deerhaven Trail Unit 1
- 6N234 Old Farm Ln
- 6N000 Old Farm Ln
- 6N187 Old Farm Ln
- 39W750 Deerhaven Trail Unit 1