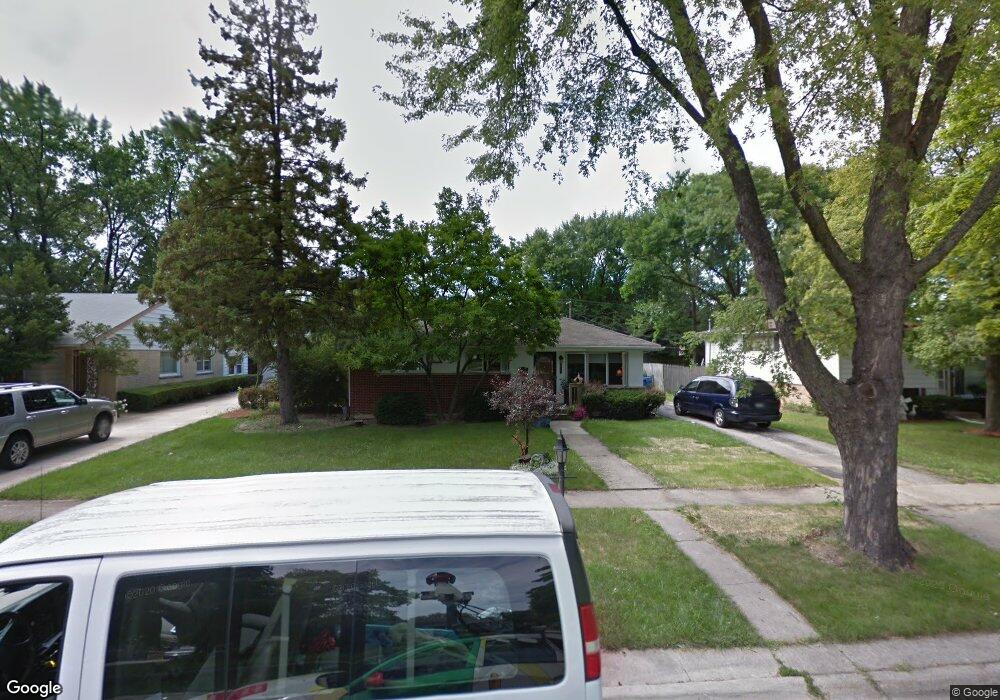
3N452 Willow Rd Elmhurst, IL 60126
Estimated Value: $366,658 - $445,000
--
Bed
--
Bath
1,308
Sq Ft
$312/Sq Ft
Est. Value
About This Home
This home is located at 3N452 Willow Rd, Elmhurst, IL 60126 and is currently estimated at $407,915, approximately $311 per square foot. 3N452 Willow Rd is a home located in DuPage County with nearby schools including Conrad Fischer Elementary School, Churchville Middle School, and York Community High School.
Ownership History
Date
Name
Owned For
Owner Type
Purchase Details
Closed on
Feb 28, 2001
Sold by
Anderson Alan A
Bought by
Anderson Alan A and Anderson Marilyn M
Current Estimated Value
Home Financials for this Owner
Home Financials are based on the most recent Mortgage that was taken out on this home.
Original Mortgage
$144,500
Outstanding Balance
$52,586
Interest Rate
7.18%
Estimated Equity
$355,329
Purchase Details
Closed on
Feb 21, 2001
Sold by
Anderson Marilyn M
Bought by
Anderson Alan A
Home Financials for this Owner
Home Financials are based on the most recent Mortgage that was taken out on this home.
Original Mortgage
$144,500
Outstanding Balance
$52,586
Interest Rate
7.18%
Estimated Equity
$355,329
Purchase Details
Closed on
Jul 28, 2000
Sold by
Lasalle Bank National Assn
Bought by
Anderson Alan A and Anderson Marilyn M
Home Financials for this Owner
Home Financials are based on the most recent Mortgage that was taken out on this home.
Original Mortgage
$140,000
Interest Rate
8.24%
Create a Home Valuation Report for This Property
The Home Valuation Report is an in-depth analysis detailing your home's value as well as a comparison with similar homes in the area
Home Values in the Area
Average Home Value in this Area
Purchase History
| Date | Buyer | Sale Price | Title Company |
|---|---|---|---|
| Anderson Alan A | -- | -- | |
| Anderson Alan A | -- | Sbi Title Inc | |
| Anderson Alan A | $175,000 | Fox Title Company |
Source: Public Records
Mortgage History
| Date | Status | Borrower | Loan Amount |
|---|---|---|---|
| Open | Anderson Alan A | $144,500 | |
| Closed | Anderson Alan A | $140,000 |
Source: Public Records
Tax History Compared to Growth
Tax History
| Year | Tax Paid | Tax Assessment Tax Assessment Total Assessment is a certain percentage of the fair market value that is determined by local assessors to be the total taxable value of land and additions on the property. | Land | Improvement |
|---|---|---|---|---|
| 2024 | $6,706 | $123,183 | $54,695 | $68,488 |
| 2023 | $6,165 | $113,240 | $50,280 | $62,960 |
| 2022 | $5,686 | $104,340 | $46,330 | $58,010 |
| 2021 | $5,417 | $99,940 | $44,380 | $55,560 |
| 2020 | $5,070 | $95,730 | $42,510 | $53,220 |
| 2019 | $5,018 | $92,040 | $40,870 | $51,170 |
| 2018 | $4,811 | $87,660 | $38,920 | $48,740 |
| 2017 | $4,692 | $83,780 | $37,200 | $46,580 |
| 2016 | $4,488 | $77,360 | $34,350 | $43,010 |
| 2015 | $4,373 | $71,460 | $31,730 | $39,730 |
| 2014 | $4,132 | $63,570 | $30,800 | $32,770 |
| 2013 | $4,094 | $64,870 | $31,430 | $33,440 |
Source: Public Records
Map
Nearby Homes
- 3N425 N Howard Ave
- 3N276 N Howard Ave
- 841 N York St Unit 101
- 841 N York St Unit 332
- 841 N York St Unit 129
- 909 N Addison Ave
- 1043 S York Rd Unit 209
- 1043 S York Rd Unit 208
- 1043 S York Rd Unit 411
- 1043 S York Rd Unit 605
- 281 E North End Ave
- 791 N Adele St
- 128 David Dr
- 738 N Parker St
- 818 Brentwood Dr
- 342 Diana Ct
- 728 N Parker St
- 634 N Kenilworth Ave
- 809 Brentwood Dr
- 859 John St
- 3N444 Willow Rd
- 3N460 Willow Rd
- 3N434 Willow Rd
- 3N470 Willow Rd
- 3N451 Crown Rd
- 3N445 Crown Rd
- 3N451 Willow Rd
- 459 N Willow Rd
- 3N455 Crown Rd
- 15W532 Diversey Ave
- 3N465 Crown Rd
- 3N459 Willow Rd
- 3N480 Willow Rd
- 3N421 Crown Rd
- 3N441 Willow Rd
- 3N469 Willow Rd
- 3N427 Willow Rd
- 3N479 Crown Rd
- 3N486 Willow Rd
- 3N450 Crown Rd