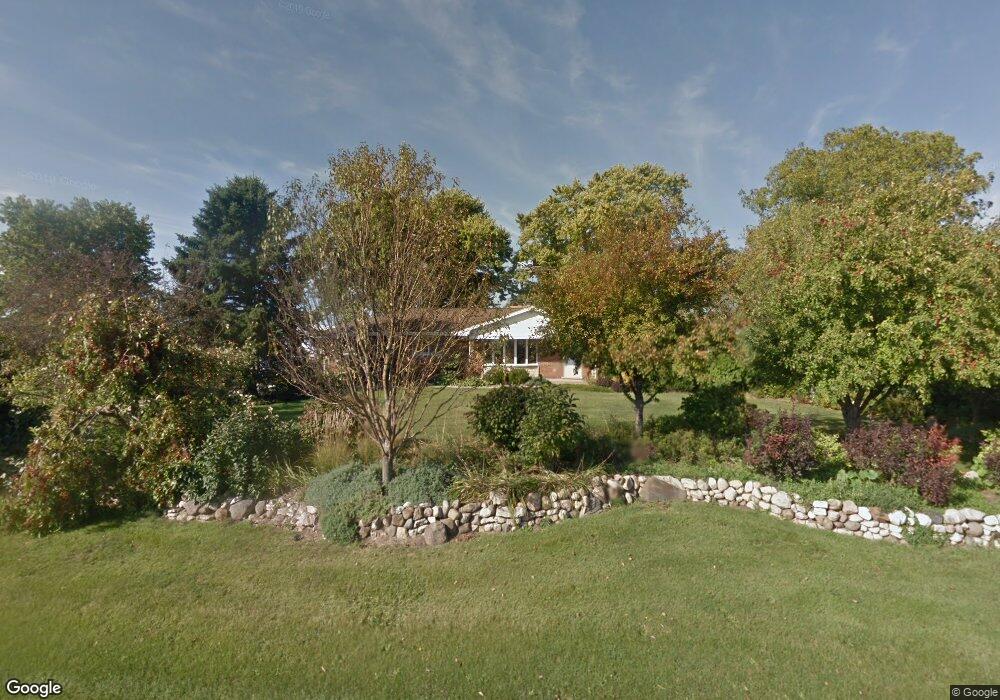
3N800 Thatcher Rd Maple Park, IL 60151
Estimated Value: $265,269 - $585,000
Studio
--
Bath
2,237
Sq Ft
$192/Sq Ft
Est. Value
About This Home
This home is located at 3N800 Thatcher Rd, Maple Park, IL 60151 and is currently estimated at $428,423, approximately $191 per square foot. 3N800 Thatcher Rd is a home with nearby schools including Kaneland John Stewart Elementary School, Harter Middle School, and Kaneland High School.
Ownership History
Date
Name
Owned For
Owner Type
Purchase Details
Closed on
Feb 10, 2022
Sold by
Lynch Loretta M
Bought by
Lynch Loretta M and Maurer Christian A
Current Estimated Value
Purchase Details
Closed on
Nov 16, 2021
Sold by
Lynch Guadalupe A
Bought by
Lynch Loretta M
Home Financials for this Owner
Home Financials are based on the most recent Mortgage that was taken out on this home.
Original Mortgage
$125,600
Interest Rate
2.99%
Mortgage Type
New Conventional
Purchase Details
Closed on
Nov 24, 1997
Sold by
Lynch Jeremiah and Jeremiah Lynch Declaration Of
Bought by
Lynch Jeremiah and Lynch Guadalupe A
Home Financials for this Owner
Home Financials are based on the most recent Mortgage that was taken out on this home.
Original Mortgage
$220,000
Interest Rate
10.75%
Purchase Details
Closed on
Apr 21, 1995
Sold by
Lynch Jeremiah and Lynch Guadalupe
Bought by
Lynch Jeremiah and Lynch Guadalupe A
Create a Home Valuation Report for This Property
The Home Valuation Report is an in-depth analysis detailing your home's value as well as a comparison with similar homes in the area
Home Values in the Area
Average Home Value in this Area
Purchase History
| Date | Buyer | Sale Price | Title Company |
|---|---|---|---|
| Lynch Loretta M | -- | Krupp & Krupp Llp | |
| Lynch Loretta M | $157,000 | None Available | |
| Lynch Jeremiah | -- | Chicago Title Insurance Co | |
| Lynch Jeremiah | -- | -- |
Source: Public Records
Mortgage History
| Date | Status | Borrower | Loan Amount |
|---|---|---|---|
| Previous Owner | Lynch Loretta M | $125,600 | |
| Previous Owner | Lynch Jeremiah | $220,000 |
Source: Public Records
Tax History
| Year | Tax Paid | Tax Assessment Tax Assessment Total Assessment is a certain percentage of the fair market value that is determined by local assessors to be the total taxable value of land and additions on the property. | Land | Improvement |
|---|---|---|---|---|
| 2024 | $9,954 | $131,513 | $38,831 | $92,682 |
| 2023 | $9,885 | $122,571 | $35,980 | $86,591 |
| 2022 | $9,587 | $114,049 | $33,278 | $80,771 |
| 2021 | $8,782 | $108,462 | $31,431 | $77,031 |
| 2020 | $5,966 | $104,689 | $30,124 | $74,565 |
| 2019 | $6,068 | $100,614 | $28,751 | $71,863 |
| 2018 | $6,206 | $95,044 | $26,974 | $68,070 |
| 2017 | $6,352 | $89,930 | $25,349 | $64,581 |
| 2016 | $6,403 | $84,538 | $23,724 | $60,814 |
| 2015 | -- | $78,045 | $22,254 | $55,791 |
| 2014 | -- | $75,909 | $21,528 | $54,381 |
| 2013 | -- | $75,709 | $21,328 | $54,381 |
Source: Public Records
Map
Nearby Homes
- 000 Winters Rd
- 2N879 Howard Rd
- 0 Winters Rd
- 00 Welter Rd
- 804 Elm St
- 218 Virgil St
- 417 Virgil St
- 205 Center St
- 429 E Dekalb Dr
- 247 W Dekalb Dr
- 688 S Elizabeth St Unit 688
- 5N487 County Line Rd
- 328 W Chester Dr
- 49W972 Peterson Rd
- 756 W Ashton Dr
- 0N953 Probst Ct
- 48W201 Keslinger Rd
- 410 W Reader St
- 23007 Lovell Rd
- 214 Read St
- 49 Thatcher Rd
- 00 Thatcher Rd
- 000 Thatcher Rd
- 3N576 Thatcher Rd
- 47W728 I C Trail
- 48W692 Beith Rd
- 48W446 Beith Rd
- 2 Lots Ramm Woods Dr
- 154 Inverness St
- 207 Inverness St
- 153 Inverness St
- Lot 11 Ramm Woods Dr
- Lot 8 S Ramm Woods Dr
- Lot 6 Ramm Woods Dr
- Lot 4 S Ramm Woods Dr
- 148 Inverness St
- Lot 003 Rt 64
- 07088 Sauber Rd N(3+ac)
- NW Rt 64 & 47
- 3 Lots Ramm Woods Dr
Your Personal Tour Guide
Ask me questions while you tour the home.