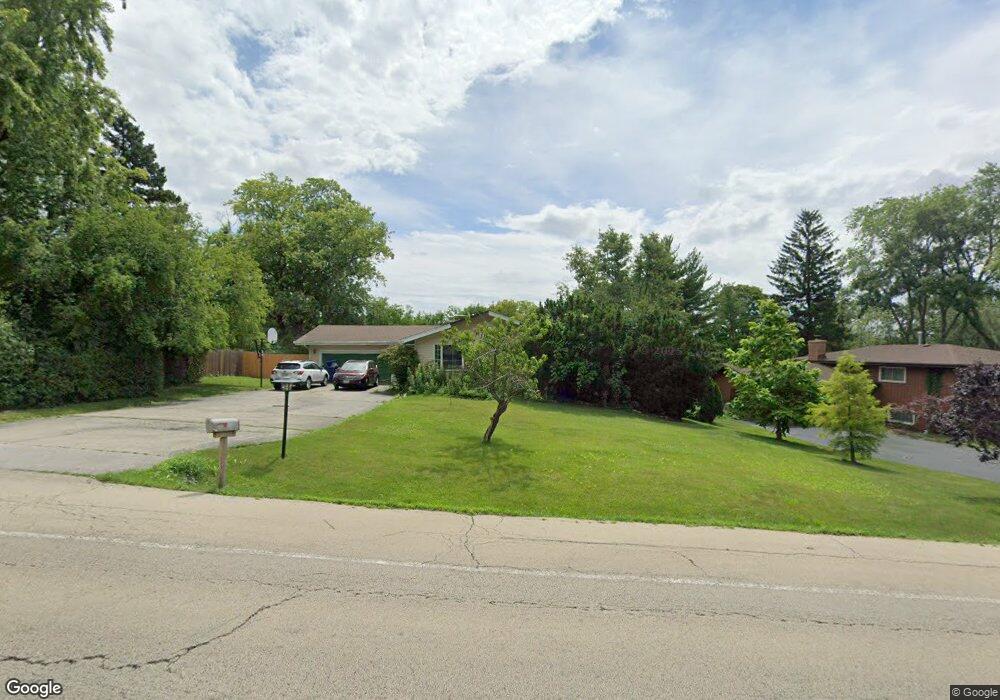
3S151 Park Blvd Glen Ellyn, IL 60137
Estimated Value: $409,150 - $492,000
5
Beds
2
Baths
1,400
Sq Ft
$327/Sq Ft
Est. Value
About This Home
This home is located at 3S151 Park Blvd, Glen Ellyn, IL 60137 and is currently estimated at $457,288, approximately $326 per square foot. 3S151 Park Blvd is a home located in DuPage County with nearby schools including Arbor View Elementary School, Glen Crest Middle School, and Glenbard South High School.
Ownership History
Date
Name
Owned For
Owner Type
Purchase Details
Closed on
Mar 5, 2009
Sold by
Dunne John P and Dunne Dana G
Bought by
Dunne John P
Current Estimated Value
Purchase Details
Closed on
Mar 1, 2006
Sold by
Olsofka Joseph P and Olsofka Bernadine
Bought by
Dunne John P and Dunne Dana G
Home Financials for this Owner
Home Financials are based on the most recent Mortgage that was taken out on this home.
Original Mortgage
$260,000
Outstanding Balance
$162,040
Interest Rate
7.97%
Mortgage Type
Fannie Mae Freddie Mac
Estimated Equity
$295,248
Purchase Details
Closed on
Aug 15, 2001
Sold by
Santeler Beverly A
Bought by
Olsofka Joseph P and Olsofka Bernadine
Home Financials for this Owner
Home Financials are based on the most recent Mortgage that was taken out on this home.
Original Mortgage
$218,300
Interest Rate
7.28%
Create a Home Valuation Report for This Property
The Home Valuation Report is an in-depth analysis detailing your home's value as well as a comparison with similar homes in the area
Home Values in the Area
Average Home Value in this Area
Purchase History
| Date | Buyer | Sale Price | Title Company |
|---|---|---|---|
| Dunne John P | -- | None Available | |
| Dunne John P | $325,000 | First American Title | |
| Olsofka Joseph P | $273,000 | -- |
Source: Public Records
Mortgage History
| Date | Status | Borrower | Loan Amount |
|---|---|---|---|
| Open | Dunne John P | $260,000 | |
| Previous Owner | Olsofka Joseph P | $218,300 | |
| Closed | Olsofka Joseph P | $27,200 |
Source: Public Records
Tax History Compared to Growth
Tax History
| Year | Tax Paid | Tax Assessment Tax Assessment Total Assessment is a certain percentage of the fair market value that is determined by local assessors to be the total taxable value of land and additions on the property. | Land | Improvement |
|---|---|---|---|---|
| 2024 | $6,966 | $105,881 | $28,388 | $77,493 |
| 2023 | $6,617 | $97,460 | $26,130 | $71,330 |
| 2022 | $7,819 | $112,460 | $24,690 | $87,770 |
| 2021 | $7,626 | $109,790 | $24,100 | $85,690 |
| 2020 | $7,672 | $108,770 | $23,880 | $84,890 |
| 2019 | $7,447 | $105,900 | $23,250 | $82,650 |
| 2018 | $7,111 | $100,290 | $21,910 | $78,380 |
| 2017 | $6,553 | $96,590 | $21,100 | $75,490 |
| 2016 | $6,439 | $92,730 | $20,260 | $72,470 |
| 2015 | $6,374 | $88,470 | $19,330 | $69,140 |
| 2014 | $7,381 | $100,030 | $20,460 | $79,570 |
| 2013 | $7,137 | $100,330 | $20,520 | $79,810 |
Source: Public Records
Map
Nearby Homes
- 3S138 Park Blvd
- 22W351 Birchwood Dr
- 3S240 Burr Oak Dr
- 22W506 Arbor Ln
- 22W633 Burr Oak Dr
- 23W111 Mulberry Ln
- 22W425 Arbor Ln
- 2S651 Ashley Dr
- 2254 Blacksmith Dr
- 2S630 Devonshire Ln
- 22W041 Pinegrove Ct
- 23W160 Woodcroft Dr
- 2S365 Milton Ave
- 1888 Cheshire Ln
- 1260 Windsor Dr
- 21W745 Glen Valley Dr
- 470 Fawell Blvd Unit 510
- 470 Fawell Blvd Unit 320
- 453 Raintree Dr Unit 5E
- 450 Raintree Dr Unit 2F
- 3S135 Park Blvd
- 3S159 Park Blvd
- 3S171 Park Blvd
- 3S121 Park Blvd
- 3S160 Shagbark Ln
- 3S154 Park Blvd
- 3S150 Shagbark Ln
- 3S164 Park Blvd Unit 2
- 3S174 Shagbark Ln
- 22W545 Birchwood Dr
- 3S126 Park Blvd
- 3S185 Park Blvd
- 3S186 Shagbark Ln
- 3S107 Park Blvd
- 3S114 Park Blvd
- 3S178 Park Blvd
- 3S210 Shagbark Ln
- 3S123 Mulberry Ln
- 3S100 Park Blvd
- 3S133 Mulberry Ln