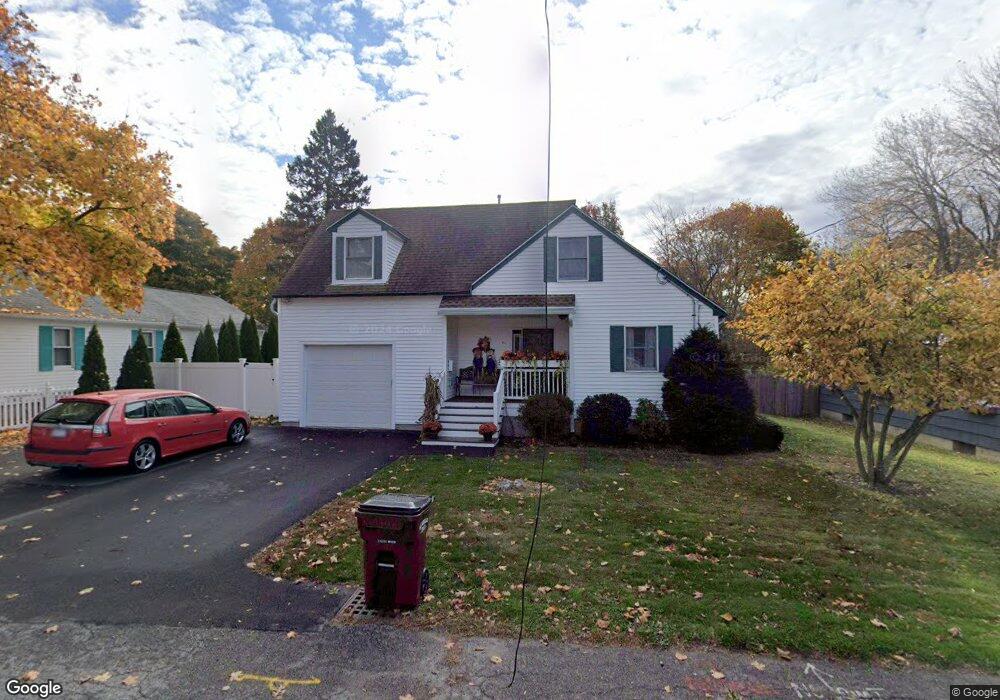
4 1/2 Lafayette St Amesbury, MA 01913
Estimated Value: $630,000 - $705,000
4
Beds
2
Baths
1,647
Sq Ft
$403/Sq Ft
Est. Value
About This Home
This home is located at 4 1/2 Lafayette St, Amesbury, MA 01913 and is currently estimated at $663,921, approximately $403 per square foot. 4 1/2 Lafayette St is a home located in Essex County with nearby schools including Amesbury High School and Amesbury Seventh-Day Adventist School.
Ownership History
Date
Name
Owned For
Owner Type
Purchase Details
Closed on
Mar 17, 2022
Sold by
Morin Ft
Bought by
Morin Gerard J and Morin Jeannette A
Current Estimated Value
Purchase Details
Closed on
Mar 26, 2020
Sold by
Morin Gerard J and Morin Jeannette A
Bought by
Moran Ft
Purchase Details
Closed on
Jan 25, 2016
Sold by
Morin Gerard
Bought by
Morin Gerard J and Morin Jeannette A
Purchase Details
Closed on
Dec 15, 2000
Sold by
Dunning Mark P
Bought by
Morin Gerard
Home Financials for this Owner
Home Financials are based on the most recent Mortgage that was taken out on this home.
Original Mortgage
$90,000
Interest Rate
7.7%
Mortgage Type
Purchase Money Mortgage
Create a Home Valuation Report for This Property
The Home Valuation Report is an in-depth analysis detailing your home's value as well as a comparison with similar homes in the area
Home Values in the Area
Average Home Value in this Area
Purchase History
| Date | Buyer | Sale Price | Title Company |
|---|---|---|---|
| Morin Gerard J | -- | None Available | |
| Moran Ft | -- | None Available | |
| Morin Gerard J | -- | -- | |
| Morin Gerard | $130,000 | -- |
Source: Public Records
Mortgage History
| Date | Status | Borrower | Loan Amount |
|---|---|---|---|
| Previous Owner | Morin Gerard | $160,488 | |
| Previous Owner | Morin Gerard | $175,000 | |
| Previous Owner | Morin Gerard | $170,000 | |
| Previous Owner | Morin Gerard | $90,000 |
Source: Public Records
Tax History Compared to Growth
Tax History
| Year | Tax Paid | Tax Assessment Tax Assessment Total Assessment is a certain percentage of the fair market value that is determined by local assessors to be the total taxable value of land and additions on the property. | Land | Improvement |
|---|---|---|---|---|
| 2025 | $8,426 | $550,700 | $205,600 | $345,100 |
| 2024 | $8,430 | $539,000 | $193,900 | $345,100 |
| 2023 | $7,623 | $466,500 | $168,600 | $297,900 |
| 2022 | $6,942 | $392,400 | $146,600 | $245,800 |
| 2021 | $6,523 | $357,400 | $116,600 | $240,800 |
| 2020 | $5,900 | $343,400 | $112,100 | $231,300 |
| 2019 | $5,884 | $320,300 | $112,100 | $208,200 |
| 2018 | $6,005 | $316,200 | $106,800 | $209,400 |
| 2017 | $5,762 | $288,800 | $106,800 | $182,000 |
| 2016 | $5,579 | $275,100 | $106,800 | $168,300 |
| 2015 | $5,546 | $270,000 | $106,800 | $163,200 |
| 2014 | $5,087 | $242,600 | $106,800 | $135,800 |
Source: Public Records
Map
Nearby Homes
- 204 Elm St
- 270 Elm St
- 161 Elm St Unit A
- 21 Clarks Rd Unit 203
- 47 Macy St
- 22 Huntington Ave
- 45 Macy St Unit b101
- 45 Macy St Unit 301C
- 45 Macy St Unit 302C
- 394 Main St
- 3 Laurel Place
- 382 Main St
- 118 Elm St
- 18 E Greenwood St
- 486 Main St
- 356 Main St
- 43 Aubin St Unit 1
- 5 Richs Ct Unit 3
- 97 Elm St
- 53 Rabbit Rd