NOT LISTED FOR SALE

Estimated Value: $838,000 - $1,061,000

6 Beds
3 Baths
1,976 Sq Ft
$468/Sq Ft Est. Value

Last Sold August 07, 2020

Last sale price $181,000 $92 Per Sq Ft

Est. 411% increase in value since last sale

Current estimated payment $6,640/month

1,232 Days on Market

Highlights

  • Deck
  • Low Country Architecture
  • Fenced Yard
  • Howard Elementary School Rated A-
  • Screened Porch
  • 4 Car Attached Garage

About This Home

As of August 2020

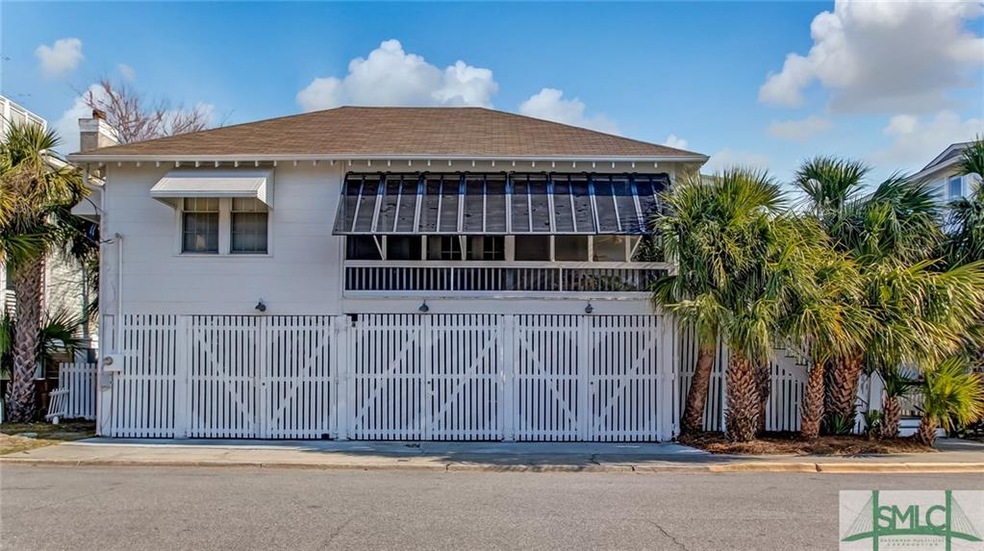
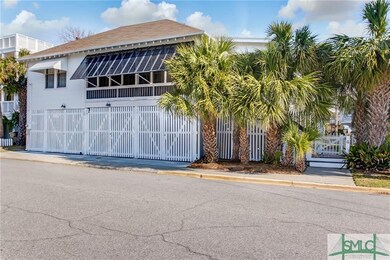
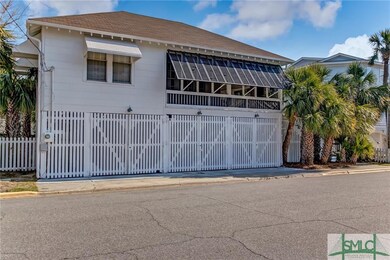
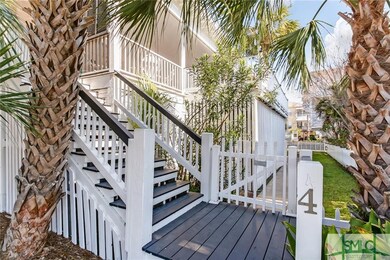
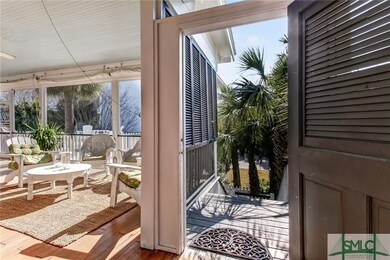
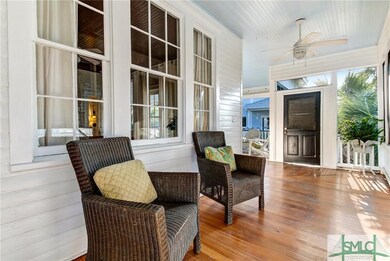
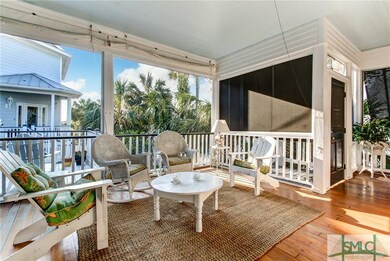
Own a 26.6% share of this historic beach house on Tybee Island! Enjoy 14 weeks a year. This beautifully decorated home sleeps 14 and has plenty of entertaining space and off-street parking. Relax and entertain on the 1132 square feet of screened porch! Walk to the beach and enjoy beach living throughout the year. Owner financing available.

Last Agent to Sell the Property

Casey Schivera

Seabolt Real Estate License #345029 Listed on: 03/24/2017

Last Buyer's Agent

Nonmls Sale

NON MLS MEMBER License #NMLS

Home Details

Home Type

  • Single Family

Year Built

  • Built in 1930

Lot Details

  • 5,619 Sq Ft Lot
  • Fenced Yard
  • Wood Fence

Home Design

  • Low Country Architecture
  • Cosmetic Repairs Needed
  • Pillar, Post or Pier Foundation
  • Asphalt Roof
  • Siding

Interior Spaces

  • 1,976 Sq Ft Home
  • 1-Story Property
  • Bookcases
  • Family Room with Fireplace
  • Screened Porch

Kitchen

  • Single Oven
  • Dishwasher

Bedrooms and Bathrooms

  • 6 Bedrooms
  • 3 Full Bathrooms

Laundry

  • Laundry Room
  • Washer and Dryer Hookup

Parking

  • 4 Car Attached Garage
  • Off-Street Parking

Utilities

  • Central Heating and Cooling System
  • Electric Water Heater

Additional Features

  • Deck
  • City Lot

Listing and Financial Details

  • Assessor Parcel Number 4-0006-18-014

Home Details

Home Type

Single Family

Year Built

Built in 1930

Lot Details

0

Listing Details

  • Construction: Siding
  • Current Zoning: R2
  • Flood Insurance: Unknown
  • Inclusions: Ceiling Fans, Dryer, Refrigerator, Washer
  • Legal Description: LOT 8 W10 FT OF LOT 9 OF A SUB OF BCH LOT 66 WARD 3 TYBEE PRB 17P 43
  • Legal Subdivision: Of A Sub
  • List Price Per Sq Ft: 93.62
  • Property Sub Type: Stick Built
  • Property Type: Residential
  • Road Surface: Asphalt
  • Style: Low Country
  • Year Built: 1930
  • Special Features: None

Interior Features

  • Appliances: Dishwasher, Single Oven
  • Full Bathrooms: 3
  • Total Bathrooms: 3.00
  • Total Bedrooms: 6
  • Common Walls: No Common Walls
  • Fireplace Features: Non-Working
  • Fireplace Location: Family Room
  • Interior: Bookcases Built-In
  • Kitchen / Breakfast: Pantry
  • Laundry: Dryer Connection, Laundry Room, Washer Connection
  • Fireplaces: 1
  • Total Sq Ft: 1976

Exterior Features

  • Exterior House: Deck, Front Porch, Porch, Screen Porch, Wrap Porch
  • Foundation: Pier
  • Roof: Asphalt
  • Structure: Cosmetic Repairs

Garage/Parking

  • Garage Spaces: 4
  • Parking Description: Attached, Drive Under/Basement, Off Street

Utilities

  • Cooling Type: Central
  • Heating Type: Central
  • Num Cooling Units: 1
  • Num Heating Units: 1
  • Num Water Heaters: 1
  • Sewer: Public Sewer
  • Underground Utilities: Yes
  • Water: Public Water
  • Water Heater Type: Electric

Lot Info

  • Exterior Lot: Fenced Yard
  • Fencing: Wood
  • List Price Per Acre: 1434108.53
  • Lot Description: City
  • Lot Num: 8
  • Lot Size Sq Ft: 5619
  • Num Acres: 0.1290
  • Parcel Number: 4-0006-18-014
  • Property Description: Full Size Lot

Tax Info

  • Annual Tax: 6804

Range of Values:

Collateral Analytics

Collateral Analytics Collateral Analytics AVMs (Automated Valuation Model) employ a number of statistical approaches combined with neighborhood-specific comparable selection guarantees the most up-to-date and precise valuations.

Not Available

Collateral Analytics does not have data for the current month. Please view the chart for historical values.

ICE

ICE Mortgage Technology ICE Mortgage Technology’s AVM (Automated Valuation Model) is a state-of-the-art online residential property valuation tool that provides a quick and accurate estimate of the value of almost any home in the U.S.

Not Available

ICE Mortgage Technology does not have data for the current month. Please view the chart for historical values.

First American

First American First American Data & Analytics’ next-generation AVM combines unrivaled data assets with a blended ensemble of valuation models to produce highly accurate, reliable valuations you can trust.

Not Available

First American does not have data for the current month. Please view the chart for historical values.

Quantarium

Quantarium Quantarium’s valuation service, repeatedly proven the industry’s most accurate and comprehensive, is supercharged with a self-learning and auto-tuning AI engine that continually becomes smarter and more accurate as it processes daily inputs from the industry’s leading RE data lake.

Not Available

Quantarium does not have data for the current month. Please view the chart for historical values.

Average Value
Not Available
List Price
Sold Price
Create a Home Valuation Report for This Property
The Home Valuation Report is an in-depth analysis detailing your home's value as well as a comparison with similar homes in the area

Home Values in the Area

Source: Public Records

Average Home Value in this Area


Source: Public Records

Property History

Date Event Price Change Sq Ft Price
08/07/2020 08/07/20 Sold $181,000 -2.2% $92 / Sq Ft
07/13/2020 07/13/20 Price Changed $185,000 -7.5% $94 / Sq Ft
02/04/2020 02/04/20 Price Changed $200,000 -20.0% $101 / Sq Ft
09/30/2019 09/30/19 For Sale $250,000 +38.1% $127 / Sq Ft
09/24/2019 09/24/19 Off Market $181,000 -- --
09/28/2018 09/28/18 For Sale $250,000 +38.1% $127 / Sq Ft
09/24/2018 09/24/18 Off Market $181,000 -- --
04/04/2018 04/04/18 Price Changed $250,000 -9.1% $127 / Sq Ft
02/27/2018 02/27/18 Price Changed $275,000 -4.5% $139 / Sq Ft
03/24/2017 03/24/17 For Sale $288,000 -- $146 / Sq Ft
Source: Savannah Multi-List Corporation

Tax History Compared to Growth

Source: Public Records

Tax History

Year Tax Paid Tax Assessment Tax Assessment Total Assessment is a certain percentage of the fair market value that is determined by local assessors to be the total taxable value of land and additions on the property. Land Improvement
2024 $18,417 $343,480 $172,520 $170,960
2023 $14,257 $343,480 $172,520 $170,960
2022 $7,171 $312,000 $172,520 $139,480
2021 $7,026 $213,360 $95,680 $117,680
2020 $7,383 $214,880 $88,320 $126,560
2019 $11,040 $214,880 $88,320 $126,560
2018 $7,315 $212,920 $88,320 $124,600
2017 $6,775 $210,280 $88,320 $121,960
2016 $6,804 $211,200 $88,320 $122,880
2015 $8,901 $183,640 $89,600 $94,040
2014 $8,891 $186,240 $0 $0
Source: Public Records

Agents Affiliated with this Home

  • Section Image
  • Section Image
See All Agents

Map

Source: Savannah Multi-List Corporation

MLS Number: 170604

Savannah Multi-List Corporation

APN: 4000618014