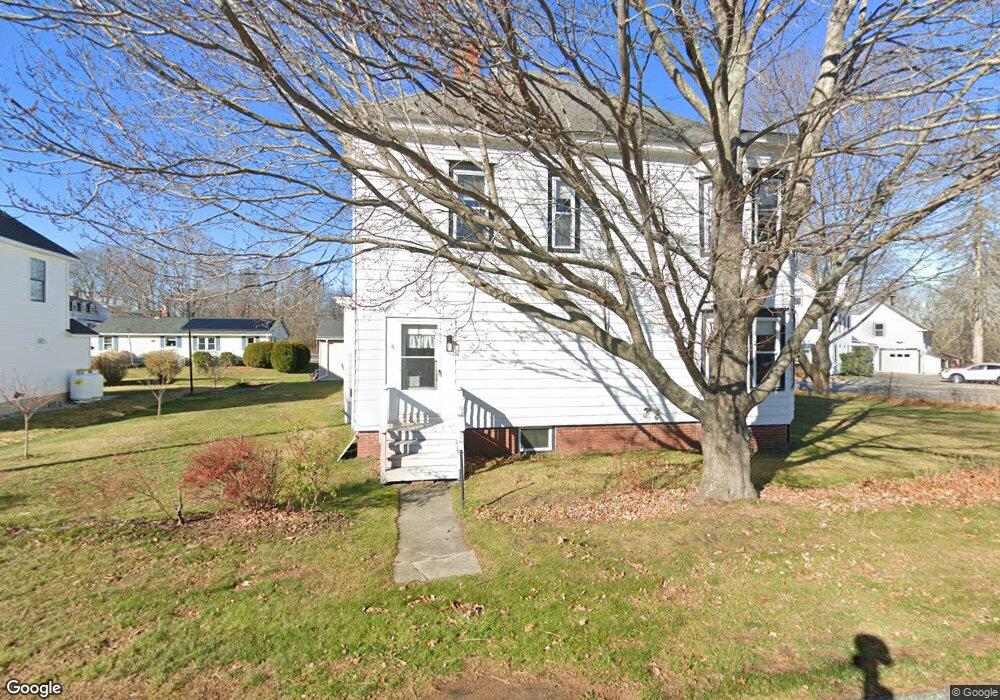
4 & 6 Highland St Biddeford, ME 04005
Estimated Value: $640,000 - $715,000
5
Beds
3
Baths
3,018
Sq Ft
$225/Sq Ft
Est. Value
About This Home
This home is located at 4 & 6 Highland St, Biddeford, ME 04005 and is currently estimated at $680,342, approximately $225 per square foot. 4 & 6 Highland St is a home located in York County with nearby schools including John F Kennedy Memorial School, Biddeford Primary School, and Biddeford Intermediate School.
Ownership History
Date
Name
Owned For
Owner Type
Purchase Details
Closed on
Sep 26, 2022
Sold by
Jordan John C
Bought by
Watczak Benjamin R and Watczak Josie L
Current Estimated Value
Home Financials for this Owner
Home Financials are based on the most recent Mortgage that was taken out on this home.
Original Mortgage
$549,958
Outstanding Balance
$522,308
Interest Rate
5.22%
Mortgage Type
FHA
Estimated Equity
$158,034
Purchase Details
Closed on
Aug 9, 2005
Sold by
Amnott Yong A and Amnott Craig J
Bought by
Jordan John C
Home Financials for this Owner
Home Financials are based on the most recent Mortgage that was taken out on this home.
Original Mortgage
$273,762
Interest Rate
5.63%
Mortgage Type
Purchase Money Mortgage
Create a Home Valuation Report for This Property
The Home Valuation Report is an in-depth analysis detailing your home's value as well as a comparison with similar homes in the area
Home Values in the Area
Average Home Value in this Area
Purchase History
| Date | Buyer | Sale Price | Title Company |
|---|---|---|---|
| Watczak Benjamin R | $575,000 | None Available | |
| Jordan John C | -- | -- |
Source: Public Records
Mortgage History
| Date | Status | Borrower | Loan Amount |
|---|---|---|---|
| Open | Watczak Benjamin R | $549,958 | |
| Previous Owner | Jordan John C | $273,762 |
Source: Public Records
Tax History
| Year | Tax Paid | Tax Assessment Tax Assessment Total Assessment is a certain percentage of the fair market value that is determined by local assessors to be the total taxable value of land and additions on the property. | Land | Improvement |
|---|---|---|---|---|
| 2025 | $7,331 | $490,700 | $166,200 | $324,500 |
| 2024 | $6,892 | $484,700 | $166,200 | $318,500 |
| 2023 | $6,265 | $477,500 | $163,300 | $314,200 |
| 2022 | $5,332 | $324,900 | $91,700 | $233,200 |
| 2021 | $5,148 | $282,400 | $77,600 | $204,800 |
| 2020 | $0 | $238,200 | $70,600 | $167,600 |
| 2019 | $2,659 | $238,200 | $70,600 | $167,600 |
| 2018 | $1,917 | $238,200 | $70,600 | $167,600 |
| 2017 | $2,659 | $220,700 | $70,600 | $150,100 |
| 2016 | $2,541 | $220,700 | $70,600 | $150,100 |
| 2015 | $4,297 | $220,700 | $70,600 | $150,100 |
| 2014 | $4,191 | $220,700 | $70,600 | $150,100 |
| 2013 | -- | $245,800 | $78,600 | $167,200 |
Source: Public Records
Map
Nearby Homes
- 4 Highland St
- 4 Highland St
- 6 Highland St
- 6 Highland St Unit 4
- 1 Mount Pleasant St
- 10 Highland St
- 3 Highland St
- 522 Main St
- 518 Main St
- 5 Highland St
- 530 Main St
- 5 Mount Pleasant St
- 79 Highland St
- 7-9 Highland St
- 9 Mount Pleasant St
- 6 Mount Pleasant St
- 514 Main St
- 532 Main St
- 18 Highland St
- 7 Highland St
Your Personal Tour Guide
Ask me questions while you tour the home.