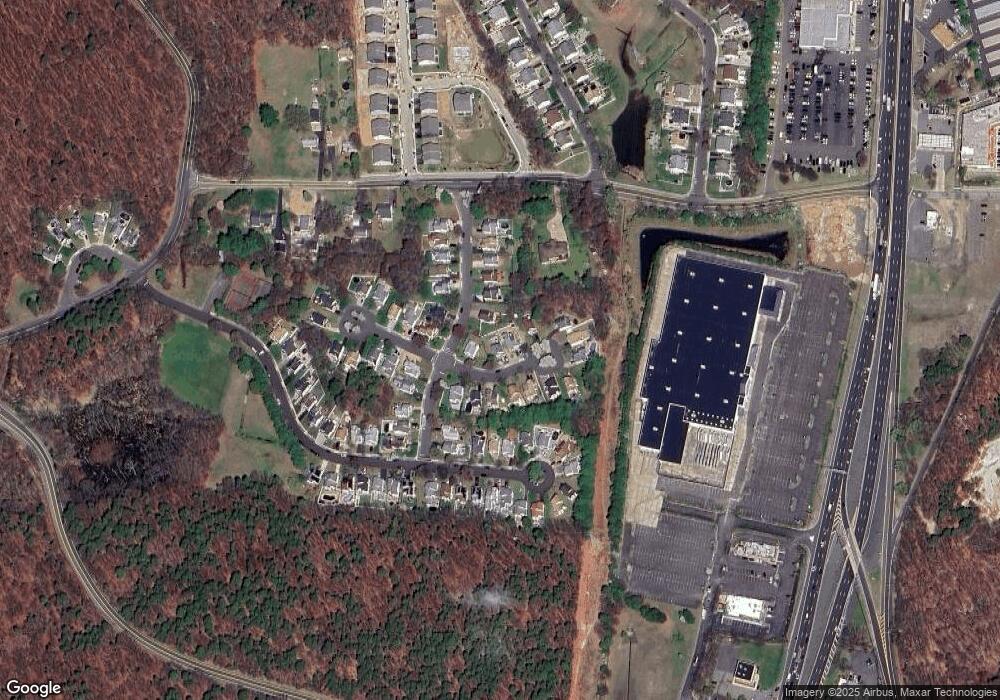
4 Amara Ct Old Bridge, NJ 08857
Estimated Value: $533,366 - $653,000
2
Beds
2
Baths
1,572
Sq Ft
$390/Sq Ft
Est. Value
About This Home
This home is located at 4 Amara Ct, Old Bridge, NJ 08857 and is currently estimated at $612,592, approximately $389 per square foot. 4 Amara Ct is a home located in Middlesex County with nearby schools including Old Bridge High School, Minding Miracles Learning Center, and New Road School of Parlin.
Ownership History
Date
Name
Owned For
Owner Type
Purchase Details
Closed on
Aug 23, 2019
Sold by
Urscheler Elaine D
Bought by
Be Amanda
Current Estimated Value
Home Financials for this Owner
Home Financials are based on the most recent Mortgage that was taken out on this home.
Original Mortgage
$295,000
Outstanding Balance
$258,895
Interest Rate
3.8%
Mortgage Type
New Conventional
Estimated Equity
$353,697
Purchase Details
Closed on
Jun 2, 2006
Sold by
Romano Lisa
Bought by
Urscheler Elaine D
Home Financials for this Owner
Home Financials are based on the most recent Mortgage that was taken out on this home.
Original Mortgage
$190,000
Interest Rate
6.62%
Purchase Details
Closed on
Oct 22, 2002
Sold by
Slattery Kenneth
Bought by
Romano Lisa and Tamburri Ilene
Home Financials for this Owner
Home Financials are based on the most recent Mortgage that was taken out on this home.
Original Mortgage
$225,000
Interest Rate
6.34%
Create a Home Valuation Report for This Property
The Home Valuation Report is an in-depth analysis detailing your home's value as well as a comparison with similar homes in the area
Home Values in the Area
Average Home Value in this Area
Purchase History
| Date | Buyer | Sale Price | Title Company |
|---|---|---|---|
| Be Amanda | $349,000 | First Integrity Title Agency | |
| Urscheler Elaine D | $350,000 | -- | |
| Romano Lisa | $250,000 | -- |
Source: Public Records
Mortgage History
| Date | Status | Borrower | Loan Amount |
|---|---|---|---|
| Open | Be Amanda | $295,000 | |
| Previous Owner | Urscheler Elaine D | $190,000 | |
| Previous Owner | Romano Lisa | $225,000 |
Source: Public Records
Tax History
| Year | Tax Paid | Tax Assessment Tax Assessment Total Assessment is a certain percentage of the fair market value that is determined by local assessors to be the total taxable value of land and additions on the property. | Land | Improvement |
|---|---|---|---|---|
| 2025 | $8,766 | $149,000 | $55,400 | $93,600 |
| 2024 | $8,430 | $149,000 | $55,400 | $93,600 |
| 2023 | $8,430 | $149,000 | $55,400 | $93,600 |
| 2022 | $8,241 | $149,000 | $55,400 | $93,600 |
| 2021 | $6,040 | $149,000 | $55,400 | $93,600 |
| 2020 | $7,988 | $149,000 | $55,400 | $93,600 |
| 2019 | $7,637 | $144,800 | $55,400 | $89,400 |
| 2018 | $7,556 | $144,800 | $55,400 | $89,400 |
| 2017 | $7,328 | $144,800 | $55,400 | $89,400 |
| 2016 | $7,191 | $144,800 | $55,400 | $89,400 |
| 2015 | $7,060 | $144,800 | $55,400 | $89,400 |
| 2014 | $6,948 | $144,800 | $55,400 | $89,400 |
Source: Public Records
Map
Nearby Homes
Your Personal Tour Guide
Ask me questions while you tour the home.