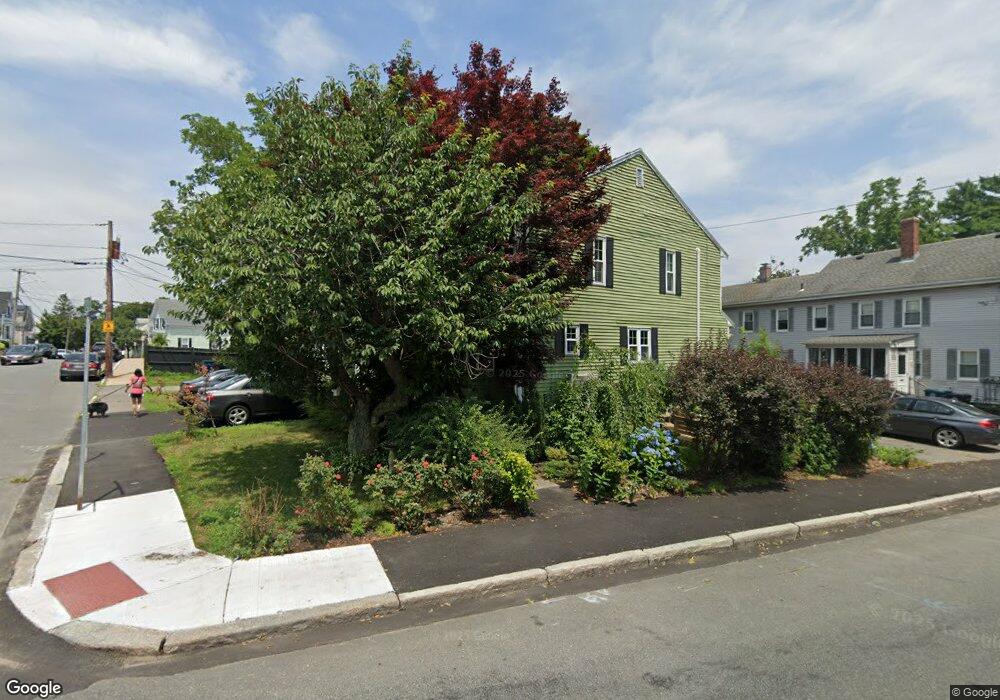
4 Balcomb St Salem, MA 01970
North Salem NeighborhoodEstimated Value: $446,000 - $507,000
2
Beds
2
Baths
1,400
Sq Ft
$339/Sq Ft
Est. Value
About This Home
This home is located at 4 Balcomb St, Salem, MA 01970 and is currently estimated at $474,831, approximately $339 per square foot. 4 Balcomb St is a home located in Essex County with nearby schools including Bates Elementary School, Witchcraft Heights Elementary School, and Saltonstall School.
Ownership History
Date
Name
Owned For
Owner Type
Purchase Details
Closed on
Aug 14, 2023
Sold by
Mcgoldrick Paul and Mcgoldrick Cheri L
Bought by
Zoto Ardian and Zoto Alma
Current Estimated Value
Home Financials for this Owner
Home Financials are based on the most recent Mortgage that was taken out on this home.
Original Mortgage
$352,000
Outstanding Balance
$342,412
Interest Rate
6.71%
Mortgage Type
Purchase Money Mortgage
Estimated Equity
$132,419
Purchase Details
Closed on
Jul 19, 2004
Sold by
Kim Hannah Heesun
Bought by
Lee Cheryl A and Mcgoldrick Paul
Home Financials for this Owner
Home Financials are based on the most recent Mortgage that was taken out on this home.
Original Mortgage
$212,000
Interest Rate
6.25%
Mortgage Type
Purchase Money Mortgage
Purchase Details
Closed on
Jul 17, 2002
Sold by
Macinnis Jennifer M and Macinnis Peter R
Bought by
Kim Hannah Heesun
Purchase Details
Closed on
Aug 27, 1998
Sold by
Blair Barry A
Bought by
Nolan John R
Home Financials for this Owner
Home Financials are based on the most recent Mortgage that was taken out on this home.
Original Mortgage
$112,100
Interest Rate
6.9%
Mortgage Type
Purchase Money Mortgage
Create a Home Valuation Report for This Property
The Home Valuation Report is an in-depth analysis detailing your home's value as well as a comparison with similar homes in the area
Home Values in the Area
Average Home Value in this Area
Purchase History
| Date | Buyer | Sale Price | Title Company |
|---|---|---|---|
| Zoto Ardian | $440,000 | None Available | |
| Lee Cheryl A | $265,000 | -- | |
| Lee Cheryl A | $265,000 | -- | |
| Lee Cheryl A | $265,000 | -- | |
| Kim Hannah Heesun | $222,000 | -- | |
| Kim Hannah Heesun | $222,000 | -- | |
| Kim Hannah Heesun | $222,000 | -- | |
| Nolan John R | $118,000 | -- | |
| Nolan John R | $118,000 | -- | |
| Nolan John R | $118,000 | -- |
Source: Public Records
Mortgage History
| Date | Status | Borrower | Loan Amount |
|---|---|---|---|
| Open | Zoto Ardian | $352,000 | |
| Previous Owner | Lee Cheryl A | $212,000 | |
| Previous Owner | Nolan John R | $152,000 | |
| Previous Owner | Nolan John R | $112,100 |
Source: Public Records
Tax History
| Year | Tax Paid | Tax Assessment Tax Assessment Total Assessment is a certain percentage of the fair market value that is determined by local assessors to be the total taxable value of land and additions on the property. | Land | Improvement |
|---|---|---|---|---|
| 2025 | $4,737 | $417,700 | $0 | $417,700 |
| 2024 | $4,496 | $386,900 | $0 | $386,900 |
| 2023 | $4,001 | $319,800 | $0 | $319,800 |
| 2022 | $3,929 | $296,500 | $0 | $296,500 |
| 2021 | $3,838 | $278,100 | $0 | $278,100 |
| 2020 | $3,657 | $253,100 | $0 | $253,100 |
| 2019 | $3,600 | $238,400 | $0 | $238,400 |
| 2018 | $3,414 | $222,000 | $0 | $222,000 |
| 2017 | $3,429 | $216,200 | $0 | $216,200 |
| 2016 | $3,333 | $212,700 | $0 | $212,700 |
| 2015 | $3,359 | $204,700 | $0 | $204,700 |
Source: Public Records
Map
Nearby Homes
- 16 Oakland St
- 8 Cushing St Unit 2
- 32 Buffum St Unit 2
- 27 Liberty Hill Ave
- 1 Dunlap St
- 9 Highland St
- 111 Mason St
- 86 Flint St
- 112 North St
- 82 Flint St
- 44 Orne St Unit 44
- 30 Driscoll St
- 3 S Mason St
- 23 River St
- 68 Beaver St
- 17 Orchard St
- 128 Boston St Unit 4
- 41 Dearborn St
- 16 Franklin St Unit 2403
- 16 Franklin St Unit 1303
- 2 Balcomb St
- 6 Balcomb St
- 2 Balcomb St Unit 3-2
- 4 Balcomb St Unit 4
- 2 Balcomb St Unit 2
- 2 Balcomb St Unit 3
- 78 School St
- 31 Symonds St Unit 24
- 31 Symonds St Unit 23
- 31 Symonds St Unit 22
- 31 Symonds St Unit 21
- 31 Symonds St Unit 20
- 31 Symonds St Unit 19
- 31 Symonds St Unit 18
- 31 Symonds St Unit 17
- 31 Symonds St Unit 16
- 31 Symonds St Unit 15
- 31 Symonds St Unit 12
- 31 Symonds St Unit 11
- 31 Symonds St Unit 10
Your Personal Tour Guide
Ask me questions while you tour the home.