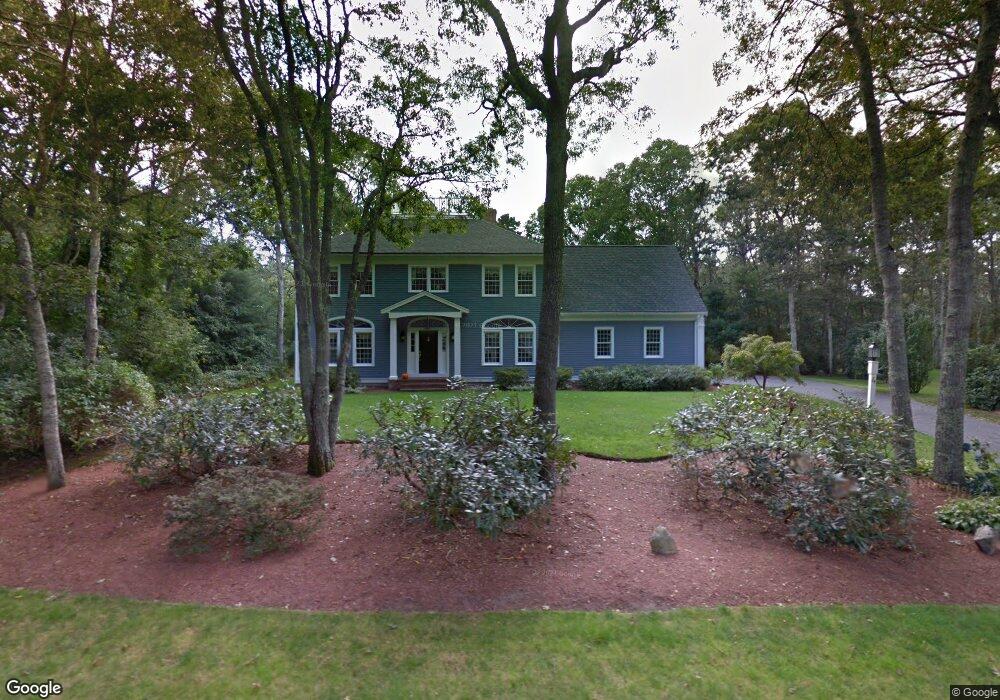
4 Barnside Ln Sandwich, MA 02563
Estimated Value: $923,000 - $1,083,000
4
Beds
3
Baths
3,749
Sq Ft
$270/Sq Ft
Est. Value
About This Home
This home is located at 4 Barnside Ln, Sandwich, MA 02563 and is currently estimated at $1,013,406, approximately $270 per square foot. 4 Barnside Ln is a home located in Barnstable County with nearby schools including Sandwich Middle High School, Sandwich Montessori School, and Riverview School.
Ownership History
Date
Name
Owned For
Owner Type
Purchase Details
Closed on
Jun 18, 2018
Sold by
Boyd Gregory P and Boyd Pamela A
Bought by
Babiarz Brandon A and Babiarz Megan C
Current Estimated Value
Home Financials for this Owner
Home Financials are based on the most recent Mortgage that was taken out on this home.
Original Mortgage
$438,796
Outstanding Balance
$385,648
Interest Rate
5.25%
Mortgage Type
FHA
Estimated Equity
$627,758
Purchase Details
Closed on
Feb 3, 1992
Sold by
Rolling Ridge Farm T
Bought by
Boyd Gregory P and Boyd Pamela A
Create a Home Valuation Report for This Property
The Home Valuation Report is an in-depth analysis detailing your home's value as well as a comparison with similar homes in the area
Home Values in the Area
Average Home Value in this Area
Purchase History
| Date | Buyer | Sale Price | Title Company |
|---|---|---|---|
| Babiarz Brandon A | $525,000 | -- | |
| Boyd Gregory P | $50,000 | -- |
Source: Public Records
Mortgage History
| Date | Status | Borrower | Loan Amount |
|---|---|---|---|
| Open | Babiarz Brandon A | $438,796 |
Source: Public Records
Tax History Compared to Growth
Tax History
| Year | Tax Paid | Tax Assessment Tax Assessment Total Assessment is a certain percentage of the fair market value that is determined by local assessors to be the total taxable value of land and additions on the property. | Land | Improvement |
|---|---|---|---|---|
| 2025 | $8,963 | $848,000 | $132,000 | $716,000 |
| 2024 | $9,122 | $844,600 | $133,600 | $711,000 |
| 2023 | $8,927 | $776,300 | $121,400 | $654,900 |
| 2022 | $8,493 | $645,400 | $117,300 | $528,100 |
| 2021 | $8,018 | $582,300 | $112,800 | $469,500 |
| 2020 | $7,958 | $556,100 | $110,800 | $445,300 |
| 2019 | $7,908 | $552,200 | $117,600 | $434,600 |
| 2018 | $7,399 | $517,800 | $113,500 | $404,300 |
| 2017 | $7,272 | $487,100 | $109,900 | $377,200 |
| 2016 | $6,957 | $480,800 | $108,800 | $372,000 |
| 2015 | $7,078 | $477,600 | $112,700 | $364,900 |
Source: Public Records
Map
Nearby Homes