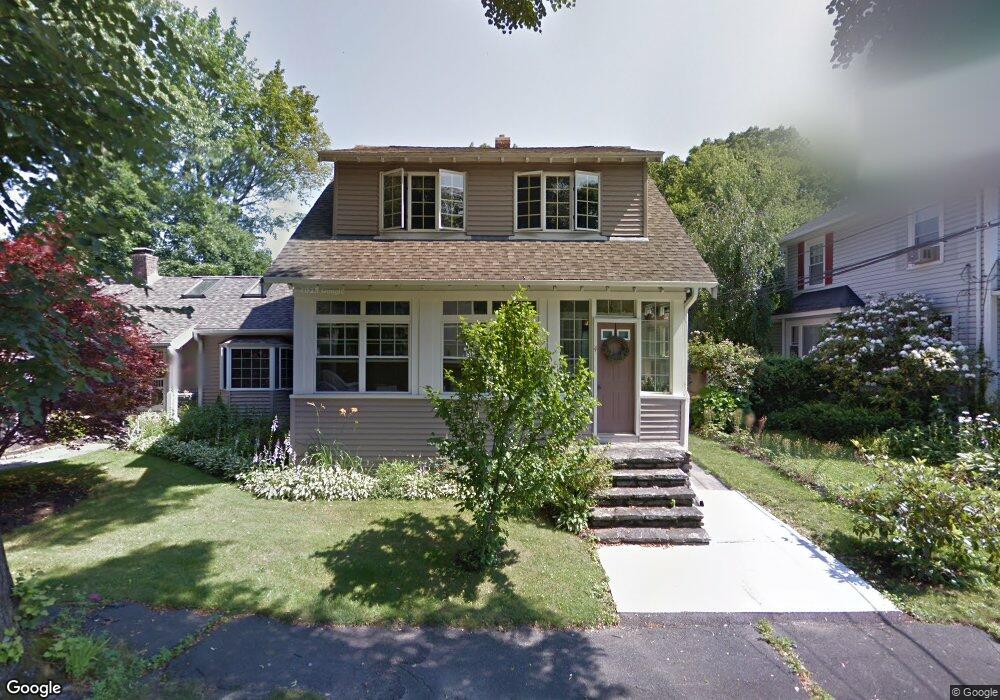
4 Barr St Worcester, MA 01602
Newton Square NeighborhoodEstimated Value: $443,000 - $630,000
3
Beds
2
Baths
2,040
Sq Ft
$263/Sq Ft
Est. Value
About This Home
This home is located at 4 Barr St, Worcester, MA 01602 and is currently estimated at $536,295, approximately $262 per square foot. 4 Barr St is a home located in Worcester County with nearby schools including Chandler Magnet, Tatnuck Magnet School, and Jacob Hiatt Magnet School.
Ownership History
Date
Name
Owned For
Owner Type
Purchase Details
Closed on
Feb 14, 2018
Sold by
Dk Nt
Bought by
Cross Denise M
Current Estimated Value
Home Financials for this Owner
Home Financials are based on the most recent Mortgage that was taken out on this home.
Original Mortgage
$155,000
Outstanding Balance
$88,028
Interest Rate
3.95%
Mortgage Type
Unknown
Estimated Equity
$448,267
Purchase Details
Closed on
Mar 10, 2008
Sold by
Cross Denise M and Cross Ronald G
Bought by
Dk Nt and Cross Denise M
Create a Home Valuation Report for This Property
The Home Valuation Report is an in-depth analysis detailing your home's value as well as a comparison with similar homes in the area
Home Values in the Area
Average Home Value in this Area
Purchase History
| Date | Buyer | Sale Price | Title Company |
|---|---|---|---|
| Cross Denise M | -- | -- | |
| Dk Nt | -- | -- |
Source: Public Records
Mortgage History
| Date | Status | Borrower | Loan Amount |
|---|---|---|---|
| Open | Cross Denise M | $155,000 |
Source: Public Records
Tax History
| Year | Tax Paid | Tax Assessment Tax Assessment Total Assessment is a certain percentage of the fair market value that is determined by local assessors to be the total taxable value of land and additions on the property. | Land | Improvement |
|---|---|---|---|---|
| 2025 | $6,534 | $495,400 | $118,300 | $377,100 |
| 2024 | $6,343 | $461,300 | $118,300 | $343,000 |
| 2023 | $6,136 | $427,900 | $102,900 | $325,000 |
| 2022 | $5,647 | $371,300 | $82,300 | $289,000 |
| 2021 | $5,789 | $355,600 | $65,900 | $289,700 |
| 2020 | $5,622 | $330,700 | $65,900 | $264,800 |
| 2019 | $5,299 | $294,400 | $59,300 | $235,100 |
| 2018 | $5,234 | $276,800 | $59,300 | $217,500 |
| 2017 | $5,026 | $261,500 | $59,300 | $202,200 |
| 2016 | $5,117 | $248,300 | $43,300 | $205,000 |
| 2015 | $4,983 | $248,300 | $43,300 | $205,000 |
| 2014 | $4,875 | $249,500 | $43,300 | $206,200 |
Source: Public Records
Map
Nearby Homes
- 73 Moore Ave
- 19 Kenilworth Rd
- 16 Sherwood Rd
- 12 Cardinal Rd
- 31 Lenox St
- 18 Hadwen Ln
- 47R Yarnie Unit 3A
- 47R Yarnie Unit 1B
- 47R Yarnie Unit 2B
- 47R Yarnie Unit 4B
- 47R Yarnie Unit 8B
- 47R Yarnie Unit 5A
- 47R Yarnie Unit 6B
- 47R Yarnie Unit 4A
- 47R Yarnie Unit 1A
- 47R Yarnie Unit 9
- 47R Yarnie Unit 8A
- 47R Yarnie Unit 6A
- 47R Yarnie Unit 7A
- 47R Yarnie Unit 5B
Your Personal Tour Guide
Ask me questions while you tour the home.