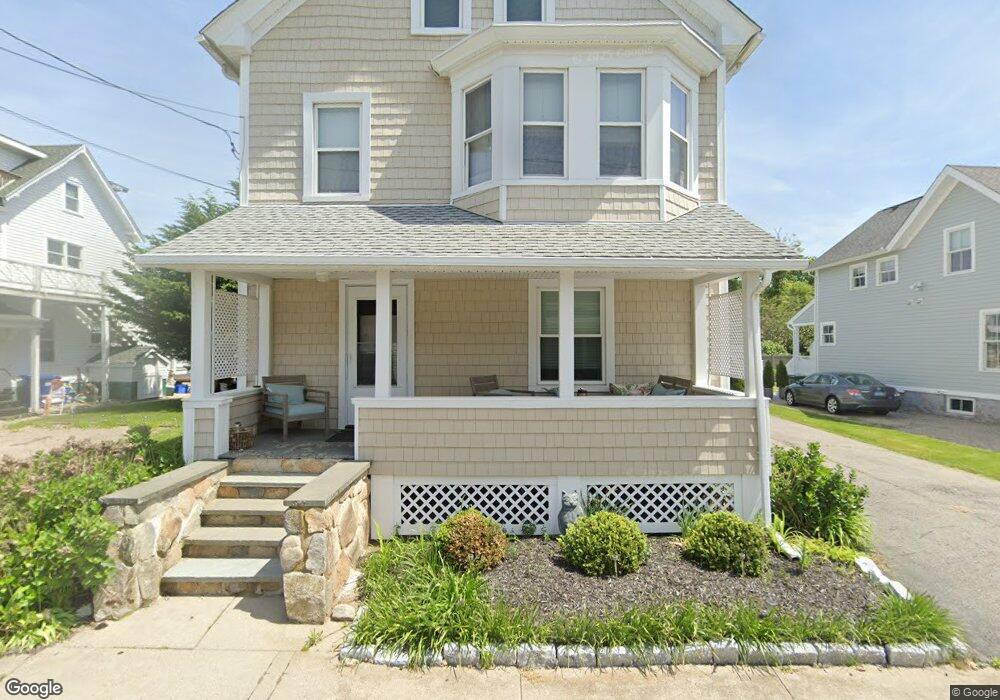
4 Bayview Ave Stonington, CT 06378
Estimated Value: $363,295 - $816,000
4
Beds
2
Baths
2,395
Sq Ft
$232/Sq Ft
Est. Value
About This Home
This home is located at 4 Bayview Ave, Stonington, CT 06378 and is currently estimated at $556,574, approximately $232 per square foot. 4 Bayview Ave is a home located in New London County with nearby schools including Stonington Middle School, Stonington High School, and Pine Point School.
Ownership History
Date
Name
Owned For
Owner Type
Purchase Details
Closed on
Jun 4, 2012
Sold by
Larkin Patricia L
Bought by
Patricia L Larkin Ret and Larkin
Current Estimated Value
Purchase Details
Closed on
May 11, 2011
Sold by
Larkin Joseph M
Bought by
Larkin Patricia
Home Financials for this Owner
Home Financials are based on the most recent Mortgage that was taken out on this home.
Original Mortgage
$100,000
Interest Rate
4.81%
Mortgage Type
Stand Alone Second
Purchase Details
Closed on
Sep 14, 2004
Sold by
Meuse John
Bought by
Larkin Joseph and Larkin Patricia
Create a Home Valuation Report for This Property
The Home Valuation Report is an in-depth analysis detailing your home's value as well as a comparison with similar homes in the area
Home Values in the Area
Average Home Value in this Area
Purchase History
| Date | Buyer | Sale Price | Title Company |
|---|---|---|---|
| Patricia L Larkin Ret | -- | -- | |
| Patricia L Larkin Ret | -- | -- | |
| Larkin Patricia | -- | -- | |
| Larkin Patricia | -- | -- | |
| Larkin Joseph | $197,300 | -- | |
| Larkin Joseph | $197,300 | -- |
Source: Public Records
Mortgage History
| Date | Status | Borrower | Loan Amount |
|---|---|---|---|
| Previous Owner | Larkin Joseph | $100,000 |
Source: Public Records
Tax History Compared to Growth
Tax History
| Year | Tax Paid | Tax Assessment Tax Assessment Total Assessment is a certain percentage of the fair market value that is determined by local assessors to be the total taxable value of land and additions on the property. | Land | Improvement |
|---|---|---|---|---|
| 2025 | $5,859 | $288,000 | $100,700 | $187,300 |
| 2024 | $5,565 | $285,400 | $100,700 | $184,700 |
| 2023 | $6,143 | $312,600 | $100,700 | $211,900 |
| 2022 | $4,913 | $184,300 | $96,300 | $88,000 |
| 2021 | $4,948 | $184,300 | $96,300 | $88,000 |
| 2020 | $4,858 | $184,300 | $96,300 | $88,000 |
| 2019 | $4,858 | $184,300 | $96,300 | $88,000 |
| 2018 | $4,714 | $184,300 | $96,300 | $88,000 |
| 2017 | $4,130 | $159,900 | $96,300 | $63,600 |
| 2016 | $4,015 | $159,900 | $96,300 | $63,600 |
| 2015 | $3,841 | $159,900 | $96,300 | $63,600 |
| 2014 | $3,671 | $160,100 | $96,300 | $63,800 |
Source: Public Records
Map
Nearby Homes