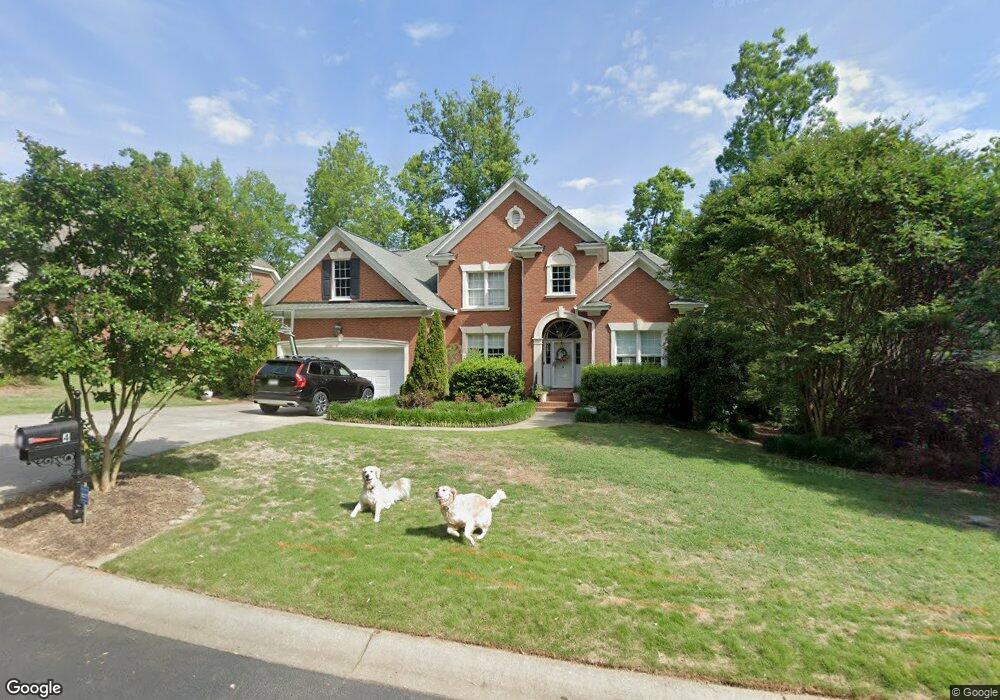
4 Baywood Ct Chapin, SC 29036
Estimated Value: $531,000 - $707,000
5
Beds
3
Baths
3,118
Sq Ft
$205/Sq Ft
Est. Value
About This Home
This home is located at 4 Baywood Ct, Chapin, SC 29036 and is currently estimated at $640,611, approximately $205 per square foot. 4 Baywood Ct is a home located in Richland County with nearby schools including Lake Murray Elementary School, Chapin Intermediate, and Chapin High School.
Ownership History
Date
Name
Owned For
Owner Type
Purchase Details
Closed on
Nov 29, 2010
Sold by
Dixon Jay D and Dixon Catherine T
Bought by
Palmer Seth T and Palmer Kelly W
Current Estimated Value
Home Financials for this Owner
Home Financials are based on the most recent Mortgage that was taken out on this home.
Original Mortgage
$346,750
Outstanding Balance
$227,963
Interest Rate
4.2%
Mortgage Type
New Conventional
Estimated Equity
$412,648
Purchase Details
Closed on
Mar 5, 2003
Sold by
Abner Building Co Inc
Bought by
Dixon Jay D and Dixon Catherine T
Home Financials for this Owner
Home Financials are based on the most recent Mortgage that was taken out on this home.
Original Mortgage
$236,000
Interest Rate
5.89%
Purchase Details
Closed on
Jun 13, 2002
Sold by
Boulevard Partners Llc
Bought by
Abner Building Co Inc
Home Financials for this Owner
Home Financials are based on the most recent Mortgage that was taken out on this home.
Original Mortgage
$218,000
Interest Rate
6.77%
Create a Home Valuation Report for This Property
The Home Valuation Report is an in-depth analysis detailing your home's value as well as a comparison with similar homes in the area
Home Values in the Area
Average Home Value in this Area
Purchase History
| Date | Buyer | Sale Price | Title Company |
|---|---|---|---|
| Palmer Seth T | $365,000 | -- | |
| Dixon Jay D | $321,000 | -- | |
| Abner Building Co Inc | $42,000 | -- |
Source: Public Records
Mortgage History
| Date | Status | Borrower | Loan Amount |
|---|---|---|---|
| Open | Palmer Seth T | $346,750 | |
| Previous Owner | Dixon Jay D | $236,000 | |
| Previous Owner | Abner Building Co Inc | $218,000 |
Source: Public Records
Tax History Compared to Growth
Tax History
| Year | Tax Paid | Tax Assessment Tax Assessment Total Assessment is a certain percentage of the fair market value that is determined by local assessors to be the total taxable value of land and additions on the property. | Land | Improvement |
|---|---|---|---|---|
| 2023 | $3,441 | $0 | $0 | $0 |
| 2021 | $2,754 | $13,900 | $0 | $0 |
| 2020 | $2,888 | $13,900 | $0 | $0 |
| 2019 | $2,884 | $13,900 | $0 | $0 |
| 2018 | $2,355 | $12,660 | $0 | $0 |
| 2017 | $2,291 | $12,660 | $0 | $0 |
| 2016 | $2,279 | $12,660 | $0 | $0 |
| 2015 | $2,292 | $12,660 | $0 | $0 |
| 2014 | $2,286 | $316,400 | $0 | $0 |
| 2013 | -- | $12,660 | $0 | $0 |
Source: Public Records
Map
Nearby Homes
- 7 Sienna Ct
- 103 Harbors Mist Dr
- 13 Morning Breeze Ct
- 319 Sienna Dr
- 613 Sea Doo Dr
- 552 Eagles Rest Dr
- 180 Wahoo Cir
- 297 Wahoo Cir
- 515 Eagles Rest Dr
- 313 Explorer Dr
- 512 Eagles Rest Dr
- 384 Explorer Dr
- 371 Explorer Dr
- 869 Sunseeker Dr
- 379 Explorer Dr
- 873 Sunseeker Dr
- 514 Shadowood Dr
- 149 Lakeport Dr
- 1304 Silver Point Rd
- 177 Lakeport Dr
- 6 Baywood Ct
- 2 Baywood Ct
- 8 Baywood Ct
- 2 Bamboo Grove Ct
- 7 Baywood Ct
- 4 Bamboo Grove Ct
- 10 Baywood Ct
- 101 Baywood Dr
- 104 Baywood Dr
- 9 Baywood Ct
- 204 Shores Edge Dr
- 12 Baywood Ct
- 105 Baywood Dr
- 13 Baywood Ct
- 11 Bamboo Grove Ct
- 206 Shores Edge Dr
- 6 Bamboo Grove Ct
- 8 Bamboo Grove Ct
- 1 Sienna Ct
- 5 Sienna Ct