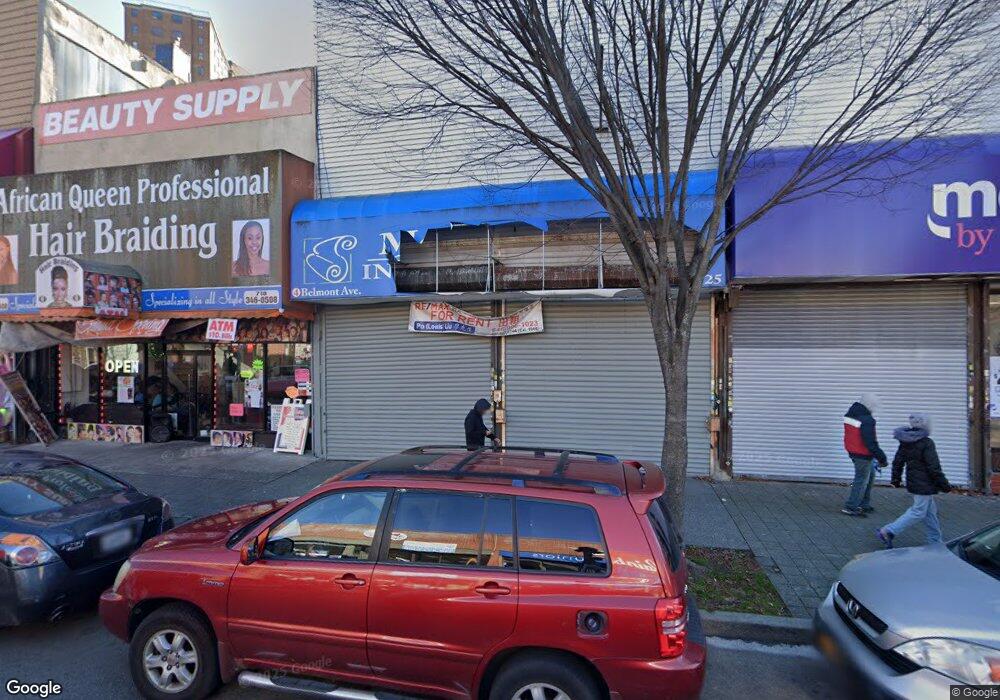
4 Belmont Ave Brooklyn, NY 11212
Brownsville NeighborhoodEstimated Value: $1,177,695
--
Bed
--
Bath
7,500
Sq Ft
$157/Sq Ft
Est. Value
About This Home
This home is located at 4 Belmont Ave, Brooklyn, NY 11212 and is currently estimated at $1,177,695, approximately $157 per square foot. 4 Belmont Ave is a home located in Kings County with nearby schools including P.S. 150 - Christopher, P.S. Is 155 Nicholas Herkimer, and P.S. 156 Waverly.
Ownership History
Date
Name
Owned For
Owner Type
Purchase Details
Closed on
Jun 6, 2024
Sold by
2 Belmont Bh 26 Llc
Bought by
Crossborder@Belmont Llc
Current Estimated Value
Purchase Details
Closed on
Feb 14, 2024
Sold by
Michael Benjamin
Bought by
2 Belmont Bh 26 Llc
Purchase Details
Closed on
Oct 27, 2016
Sold by
Zhong Shun Hao
Bought by
Friendship Belmont Llc
Purchase Details
Closed on
Feb 4, 2014
Sold by
Rockbell Realty Llc
Bought by
Zhong Shun Hao
Purchase Details
Closed on
Jul 24, 2006
Sold by
2 Belmont Avenue Associates and % United American Land Llc 430 West Br
Bought by
Rockbell Realty Llc
Home Financials for this Owner
Home Financials are based on the most recent Mortgage that was taken out on this home.
Original Mortgage
$600,000
Interest Rate
6.7%
Mortgage Type
Commercial
Create a Home Valuation Report for This Property
The Home Valuation Report is an in-depth analysis detailing your home's value as well as a comparison with similar homes in the area
Home Values in the Area
Average Home Value in this Area
Purchase History
| Date | Buyer | Sale Price | Title Company |
|---|---|---|---|
| Crossborder@Belmont Llc | -- | -- | |
| 2 Belmont Bh 26 Llc | $1,110,000 | -- | |
| 2 Belmont Bh 26 Llc | $1,110,000 | -- | |
| Friendship Belmont Llc | -- | -- | |
| Friendship Belmont Llc | -- | -- | |
| Zhong Shun Hao | $900,000 | -- | |
| Zhong Shun Hao | $900,000 | -- | |
| Rockbell Realty Llc | $800,000 | -- | |
| Rockbell Realty Llc | $800,000 | -- |
Source: Public Records
Mortgage History
| Date | Status | Borrower | Loan Amount |
|---|---|---|---|
| Previous Owner | Rockbell Realty Llc | $600,000 |
Source: Public Records
Tax History Compared to Growth
Tax History
| Year | Tax Paid | Tax Assessment Tax Assessment Total Assessment is a certain percentage of the fair market value that is determined by local assessors to be the total taxable value of land and additions on the property. | Land | Improvement |
|---|---|---|---|---|
| 2025 | $28,980 | $296,100 | $62,100 | $234,000 |
| 2024 | $28,980 | $273,600 | $62,100 | $211,500 |
| 2023 | $25,455 | $283,950 | $62,100 | $221,850 |
| 2022 | $29,184 | $271,350 | $62,100 | $209,250 |
| 2021 | $25,168 | $235,350 | $62,100 | $173,250 |
| 2020 | $33,012 | $298,800 | $62,100 | $236,700 |
| 2019 | $31,000 | $298,800 | $62,100 | $236,700 |
| 2018 | $29,438 | $340,200 | $62,100 | $278,100 |
| 2017 | $26,940 | $309,600 | $62,100 | $247,500 |
| 2016 | $25,780 | $276,300 | $62,100 | $214,200 |
| 2015 | $12,540 | $249,300 | $62,100 | $187,200 |
| 2014 | $12,540 | $224,550 | $62,100 | $162,450 |
Source: Public Records
Map
Nearby Homes
- 548 Rockaway Ave
- 117 Osborn St
- 67 Chester St Unit 3
- 51 Chester St
- 1782 Pitkin Ave
- 601 Thomas S Boyland St
- 101 Belmont Ave
- 105 Belmont Ave
- 600 Thomas S Boyland St
- 343 Rockaway Ave
- 1585 Pitkin Ave
- 1936 Prospect Place
- 96 Herzl St
- 124 Herzl St
- 589 Saratoga Ave
- 2029 Strauss St
- 1871 Prospect Place
- 637 Saratoga Ave
- 1857 Park Place
- 1563 Eastern Pkwy
- 2 Belmont Ave
- 2019-02 Belmont Ave
- 6 Belmont Ave
- 8 Belmont Ave
- 14-22 Belmont Ave
- 478-480 Rockaway Ave
- 478 Rockaway Ave
- 476 Rockaway Ave
- 464 Rockaway Ave
- 472 Rockaway Ave
- 484 Rockaway Ave Unit Building
- 484 Rockaway Ave
- 493 Rockaway Ave
- 470 Rockaway Ave
- 489 Rockaway Ave Unit 3
- 489 Rockaway Ave Unit 2
- 126 Thatford Ave
- 120 Thatford Ave
- 490-494 Rockaway Ave
- 118 Thatford Ave