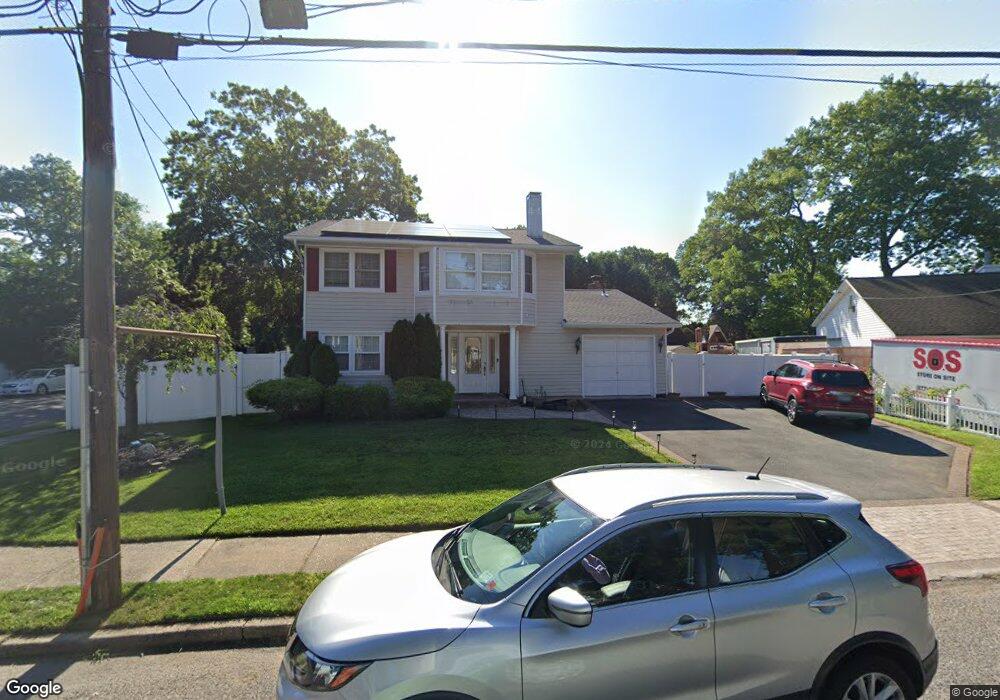
4 Bening Ln Holbrook, NY 11741
Estimated Value: $591,000 - $701,000
4
Beds
2
Baths
1,836
Sq Ft
$365/Sq Ft
Est. Value
About This Home
This home is located at 4 Bening Ln, Holbrook, NY 11741 and is currently estimated at $669,691, approximately $364 per square foot. 4 Bening Ln is a home located in Suffolk County with nearby schools including Seneca Middle School, Sachem High School North, and Long Island Baptist Academy.
Ownership History
Date
Name
Owned For
Owner Type
Purchase Details
Closed on
Feb 23, 2018
Sold by
Sally Carprara Michael and Sally Carprara
Bought by
Lucca Michael and Lucca Lori
Current Estimated Value
Home Financials for this Owner
Home Financials are based on the most recent Mortgage that was taken out on this home.
Original Mortgage
$387,000
Outstanding Balance
$325,556
Interest Rate
4.15%
Mortgage Type
New Conventional
Estimated Equity
$344,135
Purchase Details
Closed on
Feb 12, 2010
Sold by
Bondar Stephan and Bondar Valerie
Bought by
Caprara Michael and Caprara Sally
Home Financials for this Owner
Home Financials are based on the most recent Mortgage that was taken out on this home.
Original Mortgage
$360,000
Interest Rate
5.11%
Mortgage Type
Unknown
Purchase Details
Closed on
Mar 27, 1997
Sold by
Fernandez Angel A and Fernandez Wanda
Bought by
Bondar Stephan and Bondar Valerie
Create a Home Valuation Report for This Property
The Home Valuation Report is an in-depth analysis detailing your home's value as well as a comparison with similar homes in the area
Home Values in the Area
Average Home Value in this Area
Purchase History
| Date | Buyer | Sale Price | Title Company |
|---|---|---|---|
| Lucca Michael | $430,000 | -- | |
| Caprara Michael | $400,000 | -- | |
| Bondar Stephan | $135,000 | Commonwealth Land Title Ins |
Source: Public Records
Mortgage History
| Date | Status | Borrower | Loan Amount |
|---|---|---|---|
| Open | Lucca Michael | $387,000 | |
| Previous Owner | Caprara Michael | $360,000 |
Source: Public Records
Tax History Compared to Growth
Tax History
| Year | Tax Paid | Tax Assessment Tax Assessment Total Assessment is a certain percentage of the fair market value that is determined by local assessors to be the total taxable value of land and additions on the property. | Land | Improvement |
|---|---|---|---|---|
| 2024 | -- | $41,600 | $9,700 | $31,900 |
| 2023 | -- | $41,600 | $9,700 | $31,900 |
| 2022 | $8,476 | $41,600 | $9,700 | $31,900 |
| 2021 | $8,476 | $41,600 | $9,700 | $31,900 |
| 2020 | $8,476 | $41,600 | $9,700 | $31,900 |
| 2019 | $8,476 | $0 | $0 | $0 |
| 2018 | -- | $40,000 | $9,700 | $30,300 |
| 2017 | $8,447 | $40,000 | $9,700 | $30,300 |
| 2016 | $8,068 | $40,000 | $9,700 | $30,300 |
| 2015 | -- | $40,000 | $9,700 | $30,300 |
| 2014 | -- | $40,000 | $9,700 | $30,300 |
Source: Public Records
Map
Nearby Homes
- 386 Lillian Blvd
- 438 Lillian Blvd
- 376 Grace St
- 1264 Broadway Ave
- 1130 Broadway Ave
- 183 Ballad Cir
- 332 Terry Blvd
- 1101 Broadway Ave
- 16 Ballad Cir
- 1014 Coates Ave
- 70 Parkside St
- 423 Alphabet St
- 6 Dorothy Ln
- 191 Philip St
- 130 Center St
- 204 Helen St
- 275 Kerry St
- 348 Hauser Ave
- 28 Val Ct
- 228 Springmeadow Dr Unit H