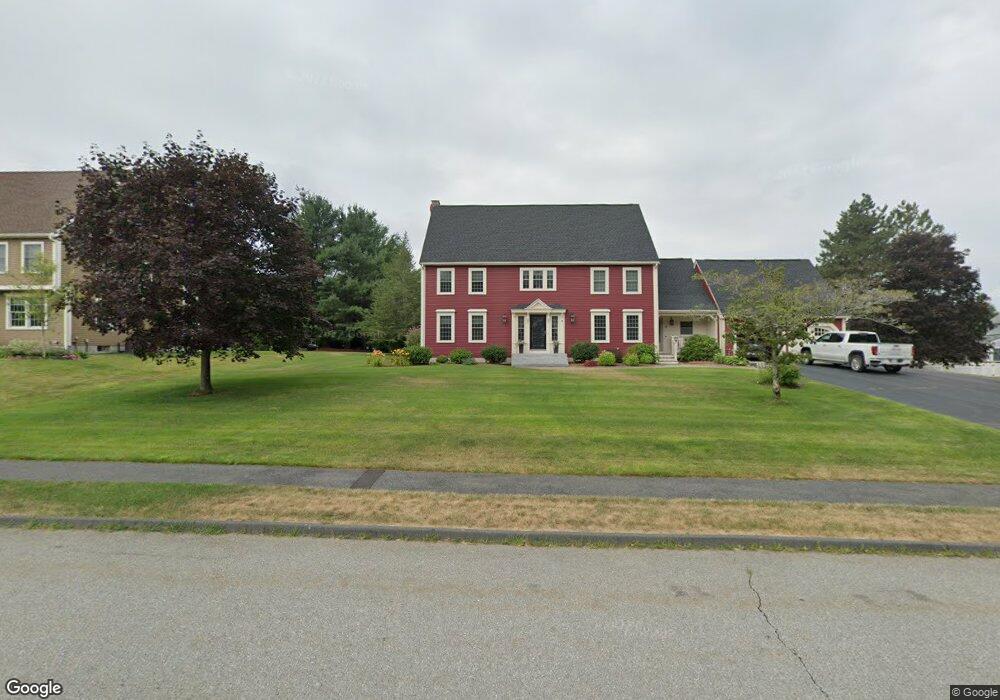
4 Benjamin Dr Westborough, MA 01581
Estimated Value: $1,014,000 - $1,370,000
4
Beds
3
Baths
2,962
Sq Ft
$402/Sq Ft
Est. Value
About This Home
This home is located at 4 Benjamin Dr, Westborough, MA 01581 and is currently estimated at $1,190,636, approximately $401 per square foot. 4 Benjamin Dr is a home located in Worcester County with nearby schools including Westborough High School, Ebridge Montessori School, and Westboro Knowledge Beginnings.
Ownership History
Date
Name
Owned For
Owner Type
Purchase Details
Closed on
Jan 30, 2020
Sold by
Benjamin Drive Rt
Bought by
Robert & Carol Hoyt Lt
Current Estimated Value
Purchase Details
Closed on
May 18, 2005
Sold by
Hoyt Carol E and Hoyt Robert F
Bought by
Benjamin Dr Rt and Hoyt Carol E
Purchase Details
Closed on
Aug 1, 1994
Sold by
Abu Construction Inc
Bought by
Hoyt Robert F and Hoyt Carol E
Home Financials for this Owner
Home Financials are based on the most recent Mortgage that was taken out on this home.
Original Mortgage
$292,800
Interest Rate
8.25%
Mortgage Type
Purchase Money Mortgage
Create a Home Valuation Report for This Property
The Home Valuation Report is an in-depth analysis detailing your home's value as well as a comparison with similar homes in the area
Home Values in the Area
Average Home Value in this Area
Purchase History
| Date | Buyer | Sale Price | Title Company |
|---|---|---|---|
| Robert & Carol Hoyt Lt | -- | None Available | |
| Benjamin Dr Rt | -- | -- | |
| Hoyt Robert F | $366,650 | -- |
Source: Public Records
Mortgage History
| Date | Status | Borrower | Loan Amount |
|---|---|---|---|
| Previous Owner | Hoyt Robert F | $280,900 | |
| Previous Owner | Hoyt Robert F | $292,000 | |
| Previous Owner | Hoyt Robert F | $292,800 |
Source: Public Records
Tax History
| Year | Tax Paid | Tax Assessment Tax Assessment Total Assessment is a certain percentage of the fair market value that is determined by local assessors to be the total taxable value of land and additions on the property. | Land | Improvement |
|---|---|---|---|---|
| 2025 | $17,155 | $1,053,100 | $375,000 | $678,100 |
| 2024 | $16,267 | $991,300 | $350,500 | $640,800 |
| 2023 | $15,878 | $942,900 | $333,500 | $609,400 |
| 2022 | $14,443 | $781,100 | $269,700 | $511,400 |
| 2021 | $14,166 | $764,100 | $252,700 | $511,400 |
| 2020 | $14,044 | $766,600 | $267,500 | $499,100 |
| 2019 | $13,942 | $760,600 | $263,300 | $497,300 |
| 2018 | $13,072 | $708,100 | $263,300 | $444,800 |
| 2017 | $12,604 | $708,100 | $263,300 | $444,800 |
| 2016 | $12,658 | $712,300 | $263,300 | $449,000 |
| 2015 | $12,128 | $652,400 | $235,900 | $416,500 |
Source: Public Records
Map
Nearby Homes
- 1 Benjamin Dr
- 22 Capt Samuel Forbush Rd
- LL39 Libbey Ln
- 192 W Main St
- 2 Libbey Ln
- 11 Quick Farm Rd
- 49 Arch St Unit 1
- 49 Arch St Unit 2
- 64 Arch St
- 17 Amherst Rd
- 60 Wesson St
- 19 Amherst Rd
- 34 Harvey Ln
- 37 Oneil Dr
- 7 Moses Wheelock Ln Unit 7
- 457 Walnut St
- 26 Mount Pleasant St
- 603 South St
- 10 Falcon Dr
- 1 Falcon Dr
Your Personal Tour Guide
Ask me questions while you tour the home.