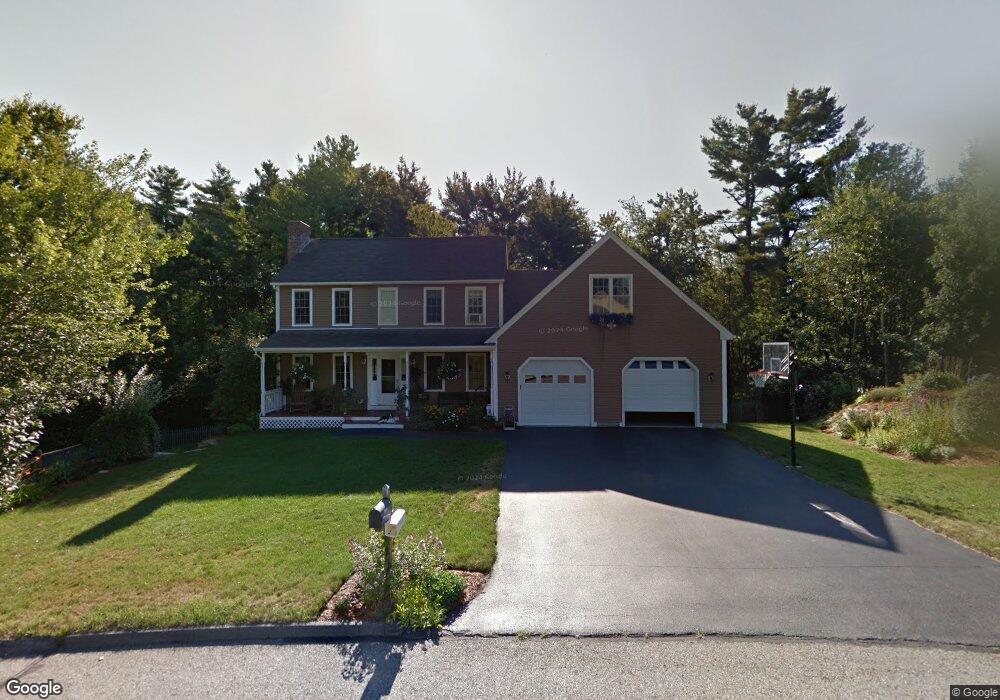
4 Bernard Rd Rutland, MA 01543
Estimated Value: $602,600 - $701,000
3
Beds
3
Baths
2,014
Sq Ft
$314/Sq Ft
Est. Value
About This Home
This home is located at 4 Bernard Rd, Rutland, MA 01543 and is currently estimated at $631,650, approximately $313 per square foot. 4 Bernard Rd is a home located in Worcester County with nearby schools including Wachusett Regional High School.
Ownership History
Date
Name
Owned For
Owner Type
Purchase Details
Closed on
Feb 18, 1998
Sold by
Gengel C&S Builders
Bought by
Hickey Shawn M and Hickey Theresa A
Current Estimated Value
Purchase Details
Closed on
Dec 5, 1997
Sold by
Leger James M
Bought by
Gengel C&S Builders
Create a Home Valuation Report for This Property
The Home Valuation Report is an in-depth analysis detailing your home's value as well as a comparison with similar homes in the area
Home Values in the Area
Average Home Value in this Area
Purchase History
| Date | Buyer | Sale Price | Title Company |
|---|---|---|---|
| Hickey Shawn M | $181,675 | -- | |
| Gengel C&S Builders | $45,000 | -- |
Source: Public Records
Mortgage History
| Date | Status | Borrower | Loan Amount |
|---|---|---|---|
| Open | Gengel C&S Builders | $229,000 | |
| Closed | Gengel C&S Builders | $235,000 | |
| Closed | Gengel C&S Builders | $204,000 |
Source: Public Records
Tax History Compared to Growth
Tax History
| Year | Tax Paid | Tax Assessment Tax Assessment Total Assessment is a certain percentage of the fair market value that is determined by local assessors to be the total taxable value of land and additions on the property. | Land | Improvement |
|---|---|---|---|---|
| 2025 | $7,435 | $522,100 | $127,400 | $394,700 |
| 2024 | $7,170 | $483,500 | $119,000 | $364,500 |
| 2023 | $6,217 | $453,100 | $112,200 | $340,900 |
| 2022 | $5,808 | $367,800 | $93,000 | $274,800 |
| 2021 | $5,815 | $348,200 | $100,900 | $247,300 |
| 2020 | $5,621 | $319,200 | $90,400 | $228,800 |
| 2019 | $5,449 | $304,600 | $78,200 | $226,400 |
| 2018 | $5,250 | $289,600 | $78,200 | $211,400 |
| 2017 | $5,305 | $289,600 | $78,200 | $211,400 |
| 2016 | $4,990 | $287,300 | $76,600 | $210,700 |
| 2015 | $4,933 | $279,500 | $76,600 | $202,900 |
| 2014 | $4,782 | $279,500 | $76,600 | $202,900 |
Source: Public Records
Map
Nearby Homes
- 25 Watson Ln
- 32 Pommogussett Rd Unit 1
- 5 Miles Rd
- 11 Lewis St
- 21 Lewis St
- 27 Lewis St
- 55 Pommogussett Rd
- 12 Lewis St
- 28 Forest Hill Dr
- 6 Lewis St
- 21 Highland Park Rd
- 2 Forest Hill Dr
- 10 Soucy Dr
- 85 Maple Ave Unit A
- 132 Fidelity Dr Unit 61
- 10 Fidelity Dr Unit 5
- 10 Beechwood Dr
- 12 Fidelity Dr Unit 6
- 7 Prescott St
- 16 Richards Ave