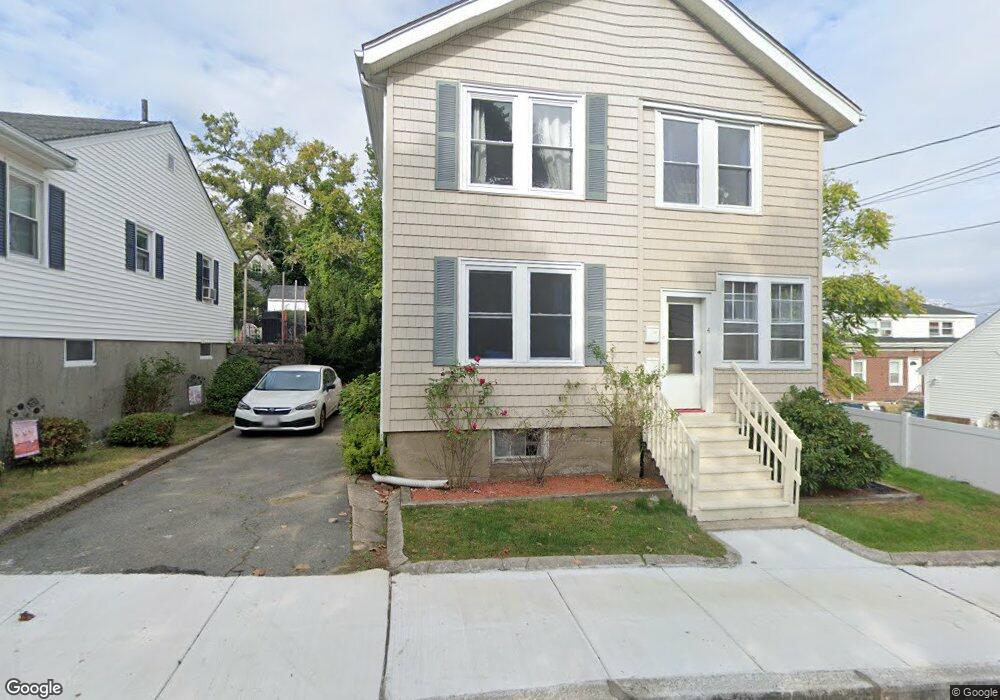
4 Bertuccio Ave Salem, MA 01970
Castle Hill NeighborhoodEstimated Value: $561,000 - $744,000
4
Beds
2
Baths
1,800
Sq Ft
$358/Sq Ft
Est. Value
About This Home
This home is located at 4 Bertuccio Ave, Salem, MA 01970 and is currently estimated at $645,297, approximately $358 per square foot. 4 Bertuccio Ave is a home located in Essex County with nearby schools including Saltonstall School, Horace Mann Laboratory, and Carlton Elementary School.
Ownership History
Date
Name
Owned For
Owner Type
Purchase Details
Closed on
May 15, 2006
Sold by
Angelopolus Adam and Angelopolus Colleen
Bought by
Poj Lidia S
Current Estimated Value
Home Financials for this Owner
Home Financials are based on the most recent Mortgage that was taken out on this home.
Original Mortgage
$311,200
Outstanding Balance
$180,234
Interest Rate
6.4%
Mortgage Type
Purchase Money Mortgage
Estimated Equity
$465,063
Purchase Details
Closed on
Aug 13, 2003
Sold by
Connelly Mark F and Connelly Sandra L
Bought by
Shea Colleen
Purchase Details
Closed on
Jan 8, 2003
Sold by
Connelly Rt
Bought by
Connelly Mark F
Purchase Details
Closed on
Nov 1, 2001
Sold by
Dylengoski Robert P
Bought by
Connelly Mark F and Connelly Sandra L
Purchase Details
Closed on
Oct 5, 1992
Sold by
P & P Heritage Tr
Bought by
Dylengoski Robert P
Purchase Details
Closed on
Mar 27, 1992
Sold by
Romano Maria A Est
Bought by
P & P Heritage Trust
Create a Home Valuation Report for This Property
The Home Valuation Report is an in-depth analysis detailing your home's value as well as a comparison with similar homes in the area
Home Values in the Area
Average Home Value in this Area
Purchase History
| Date | Buyer | Sale Price | Title Company |
|---|---|---|---|
| Poj Lidia S | $389,000 | -- | |
| Shea Colleen | $328,000 | -- | |
| Connelly Mark F | -- | -- | |
| Connelly Mark F | $270,000 | -- | |
| Dylengoski Robert P | $142,500 | -- | |
| P & P Heritage Trust | $85,000 | -- |
Source: Public Records
Mortgage History
| Date | Status | Borrower | Loan Amount |
|---|---|---|---|
| Open | P & P Heritage Trust | $311,200 | |
| Closed | P & P Heritage Trust | $38,900 |
Source: Public Records
Tax History Compared to Growth
Tax History
| Year | Tax Paid | Tax Assessment Tax Assessment Total Assessment is a certain percentage of the fair market value that is determined by local assessors to be the total taxable value of land and additions on the property. | Land | Improvement |
|---|---|---|---|---|
| 2025 | $6,659 | $587,200 | $177,000 | $410,200 |
| 2024 | $6,470 | $556,800 | $177,000 | $379,800 |
| 2023 | $6,246 | $499,300 | $162,000 | $337,300 |
| 2022 | $6,413 | $484,000 | $156,000 | $328,000 |
| 2021 | $6,240 | $452,200 | $156,000 | $296,200 |
| 2020 | $6,120 | $423,500 | $147,000 | $276,500 |
| 2019 | $6,067 | $401,800 | $139,800 | $262,000 |
| 2018 | $5,635 | $366,400 | $133,200 | $233,200 |
| 2017 | $5,469 | $344,800 | $126,000 | $218,800 |
| 2016 | $5,168 | $329,800 | $111,000 | $218,800 |
| 2015 | $5,013 | $305,500 | $102,000 | $203,500 |
Source: Public Records
Map
Nearby Homes
- 25 Calabrese St
- 9 Lyme St
- 57 Endicott St Unit 2
- 10 Hazel St Unit 2
- 7 Fairfield St
- 1 Laurent Rd Unit 3
- 10 Horton St
- 38 Chestnut St
- 288-292 Washington & 5 Porter St Ct
- 2 Hillside Ave
- 16 Leavitt St Unit 2
- 35 Flint St Unit 209
- 35 Flint St Unit 106
- 263 Jefferson Ave
- 29 Willson St
- 145 Federal St Unit 3
- 32 Park St
- 11 Summer St
- 119 Highland Ave
- 4 Willow Ave Unit 2
- 4 Bertuccio Ave Unit 1
- 4 Bertuccio Ave Unit 2
- 6 Bertuccio Ave
- 8 Bertuccio Ave
- 50 Jefferson Ave
- 0 Bertuccio Ave
- 48 Jefferson Ave
- 28 Calabrese St
- 9 Bertuccio Ave
- 23 Calabrese St
- 14 Bertuccio Ave
- 56 Jefferson Ave
- 56 Jefferson Ave Unit 1
- 56 Jefferson Ave Unit 2
- 56 Jefferson Ave Unit 3
- 24 Calabrese St
- 21 Calabrese St
- 11 Bertuccio Ave
- 18 Bertuccio Ave
- 19 Calabrese St