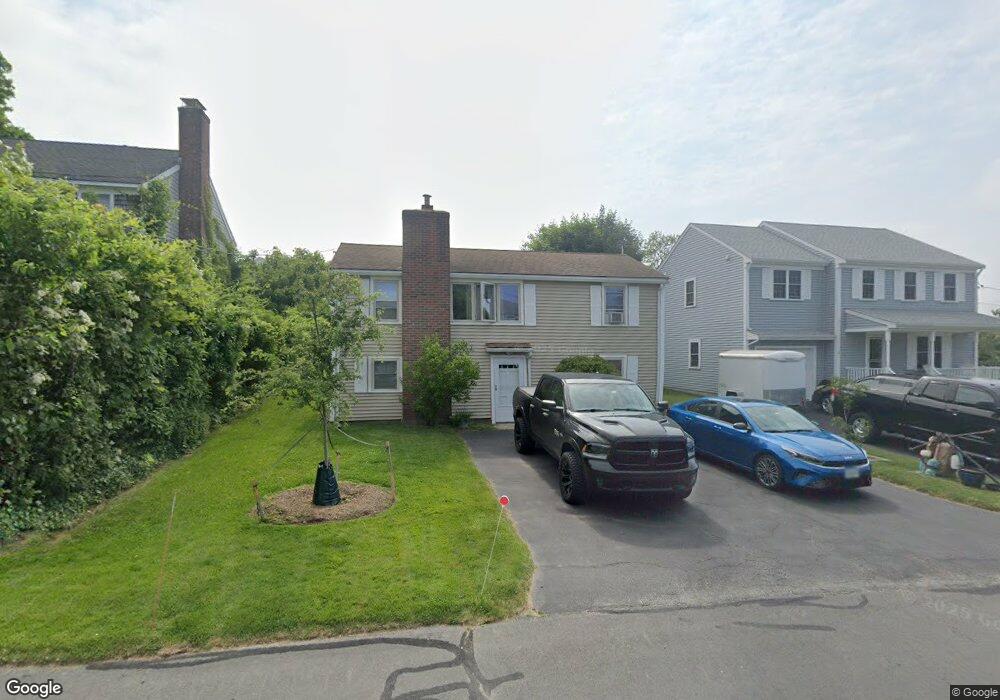
4 Bodfish Ave Sandwich, MA 02563
Estimated Value: $507,000 - $655,963
2
Beds
1
Bath
1,020
Sq Ft
$582/Sq Ft
Est. Value
About This Home
This home is located at 4 Bodfish Ave, Sandwich, MA 02563 and is currently estimated at $593,491, approximately $581 per square foot. 4 Bodfish Ave is a home located in Barnstable County with nearby schools including Sandwich Middle High School, Waldorf School of Cape Cod, and Bridgeview Montessori School.
Ownership History
Date
Name
Owned For
Owner Type
Purchase Details
Closed on
May 24, 2021
Sold by
Coache Lorraine and White Kenneth G
Bought by
Larson Mark D and Larson Rebecca S
Current Estimated Value
Home Financials for this Owner
Home Financials are based on the most recent Mortgage that was taken out on this home.
Original Mortgage
$187,500
Outstanding Balance
$169,922
Interest Rate
3.1%
Mortgage Type
Purchase Money Mortgage
Estimated Equity
$423,569
Purchase Details
Closed on
Apr 12, 2005
Sold by
Coache Lorraine
Bought by
White Kenneth G and Coache Lorraine
Create a Home Valuation Report for This Property
The Home Valuation Report is an in-depth analysis detailing your home's value as well as a comparison with similar homes in the area
Purchase History
| Date | Buyer | Sale Price | Title Company |
|---|---|---|---|
| Larson Mark D | $250,000 | None Available | |
| White Kenneth G | -- | -- |
Source: Public Records
Mortgage History
| Date | Status | Borrower | Loan Amount |
|---|---|---|---|
| Open | Larson Mark D | $187,500 |
Source: Public Records
Tax History
| Year | Tax Paid | Tax Assessment Tax Assessment Total Assessment is a certain percentage of the fair market value that is determined by local assessors to be the total taxable value of land and additions on the property. | Land | Improvement |
|---|---|---|---|---|
| 2025 | $5,764 | $545,300 | $350,400 | $194,900 |
| 2024 | $5,111 | $473,200 | $291,900 | $181,300 |
| 2023 | $4,975 | $432,600 | $265,300 | $167,300 |
| 2022 | $4,584 | $348,300 | $213,200 | $135,100 |
| 2021 | $4,481 | $325,400 | $205,000 | $120,400 |
| 2020 | $4,314 | $301,500 | $187,200 | $114,300 |
| 2019 | $4,141 | $289,200 | $182,000 | $107,200 |
| 2018 | $4,144 | $265,100 | $165,200 | $99,900 |
| 2017 | $3,683 | $246,700 | $153,100 | $93,600 |
| 2016 | $3,515 | $242,900 | $151,500 | $91,400 |
| 2015 | $3,423 | $231,000 | $142,600 | $88,400 |
Source: Public Records
Map
Nearby Homes
- 16 Town Neck Rd
- 53 Dillingham Ave
- 6 Burg Ave
- 12 Burg Ave
- 2 Freeman Ave
- 4 Freeman Ave
- 71 Dillingham Ave
- 12 Freeman Ave
- 14 Freeman Ave
- 71 Tupper Rd
- 1-3 White Cap Path Unit 1&3
- 5 White Cap Path Unit 5
- 3 Boardwalk Rd
- 7 Sunrise Ln
- 21 Seneca Ln
- 5 Pine St
- 0 Ox Pasture Rd
- 114 Salt Marsh Rd
- 38 Siasconset Dr
- 5 Rockhill Rd
Your Personal Tour Guide
Ask me questions while you tour the home.