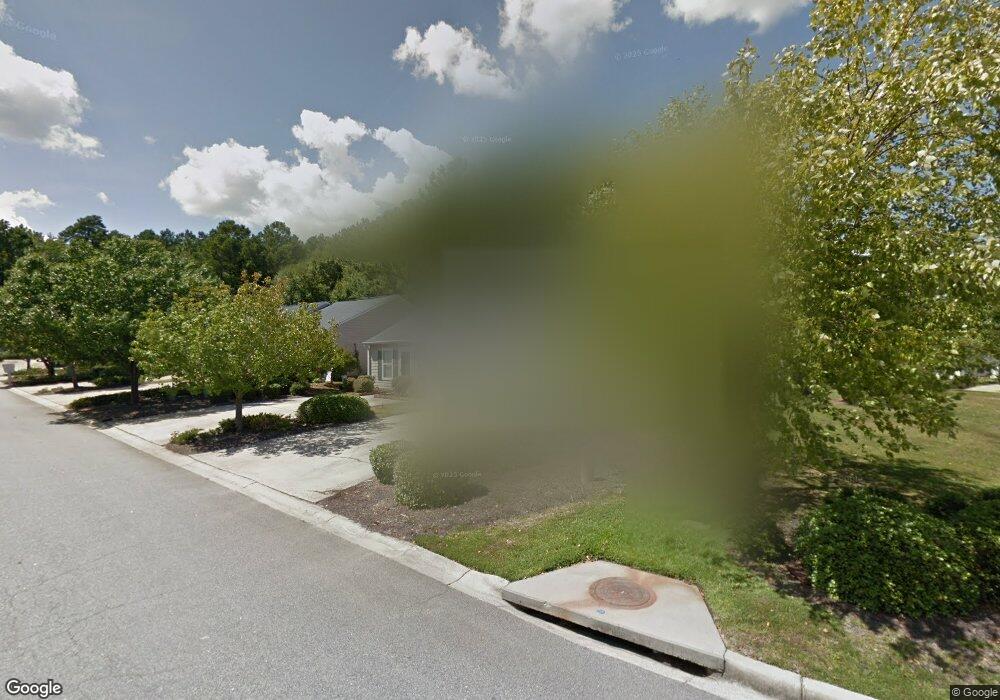
4 Boston Commons Ct Columbia, SC 29212
Saint Andrews NeighborhoodEstimated Value: $164,000 - $169,000
2
Beds
2
Baths
1,092
Sq Ft
$152/Sq Ft
Est. Value
About This Home
This home is located at 4 Boston Commons Ct, Columbia, SC 29212 and is currently estimated at $165,440, approximately $151 per square foot. 4 Boston Commons Ct is a home located in Richland County with nearby schools including Pine Grove Elementary School, St. Andrews Middle School, and Columbia High School.
Ownership History
Date
Name
Owned For
Owner Type
Purchase Details
Closed on
Nov 19, 2023
Sold by
Hill Cecelia G and Gardner George N
Bought by
Gardner George N
Current Estimated Value
Purchase Details
Closed on
Dec 28, 2016
Sold by
Hill Ceclia G
Bought by
Gardner George N
Purchase Details
Closed on
Sep 9, 2015
Sold by
Freeman Joanne B
Bought by
Hill Cecelia G
Home Financials for this Owner
Home Financials are based on the most recent Mortgage that was taken out on this home.
Original Mortgage
$60,000
Interest Rate
4.02%
Mortgage Type
New Conventional
Purchase Details
Closed on
Sep 26, 2005
Sold by
Davis Rose Marie
Bought by
Freeman Joanne B
Home Financials for this Owner
Home Financials are based on the most recent Mortgage that was taken out on this home.
Original Mortgage
$75,000
Interest Rate
5.77%
Mortgage Type
Fannie Mae Freddie Mac
Purchase Details
Closed on
Jan 26, 2005
Sold by
Davis Rose Marie
Bought by
Davis Rose Marie
Create a Home Valuation Report for This Property
The Home Valuation Report is an in-depth analysis detailing your home's value as well as a comparison with similar homes in the area
Home Values in the Area
Average Home Value in this Area
Purchase History
| Date | Buyer | Sale Price | Title Company |
|---|---|---|---|
| Gardner George N | -- | None Listed On Document | |
| Gardner George N | -- | None Available | |
| Hill Cecelia G | $31,730 | -- | |
| Freeman Joanne B | $84,000 | -- | |
| Davis Rose Marie | -- | -- |
Source: Public Records
Mortgage History
| Date | Status | Borrower | Loan Amount |
|---|---|---|---|
| Previous Owner | Hill Cecelia G | $60,000 | |
| Previous Owner | Freeman Joanne B | $75,000 |
Source: Public Records
Tax History Compared to Growth
Tax History
| Year | Tax Paid | Tax Assessment Tax Assessment Total Assessment is a certain percentage of the fair market value that is determined by local assessors to be the total taxable value of land and additions on the property. | Land | Improvement |
|---|---|---|---|---|
| 2024 | $2,508 | $91,700 | $0 | $0 |
| 2023 | $2,508 | $3,188 | $0 | $0 |
| 2022 | $579 | $79,700 | $11,300 | $68,400 |
| 2021 | $598 | $3,190 | $0 | $0 |
| 2020 | $630 | $3,190 | $0 | $0 |
| 2019 | $635 | $3,190 | $0 | $0 |
| 2018 | $610 | $3,000 | $0 | $0 |
| 2017 | $594 | $3,000 | $0 | $0 |
| 2016 | $2,133 | $4,510 | $0 | $0 |
| 2015 | $547 | $2,860 | $0 | $0 |
| 2014 | $546 | $71,400 | $0 | $0 |
| 2013 | -- | $2,860 | $0 | $0 |
Source: Public Records
Map
Nearby Homes
- 21 Colony House Ct
- 45A Battery Walk Ct
- 17 Hampton Oaks Place
- 135 Thorn Tree Ln
- 131 Heritage Village Ln
- 33 Battery Walk Ct Unit B
- 101 Thorn Tree Ln
- 13 Spring Pine Ct
- 11 Spring Pine Ct
- 123 Winding Chestnut Dr
- 119 Winding Chestnut Dr
- 117 Winding Chestnut Dr
- 122 Winding Chestnut Dr
- 124 Winding Chestnut Dr
- 125 Winding Chestnut Dr
- 127 Winding Chestnut Dr
- 17 Sweet Branch Ct
- 15 Woodpine Ct
- 18 Southpine Ct
- 421 Piney Woods Rd
- 8 Boston Commons Ct
- 5 Boston Commons Ct
- 1 Boston Commons Ct
- 7 Boston Commons Ct
- 29 Heritage Village Ln
- 9 Boston Commons Ct
- 31 Heritage Village Ln
- 27 Heritage Village Ln
- 11 Boston Commons Ct
- 25 Heritage Village Ln
- 33 Heritage Village Ln
- 24 Guilford Green Ct
- 23 Heritage Village Ln
- 37 Heritage Village Ln
- 13 Boston Commons Ct
- 4 Guilford Green Ct
- 2 Guilford Green Ct
- 16 Boston Commons Ct
- 20 Guilford Green Ct
- 190 Heritage Village Ln