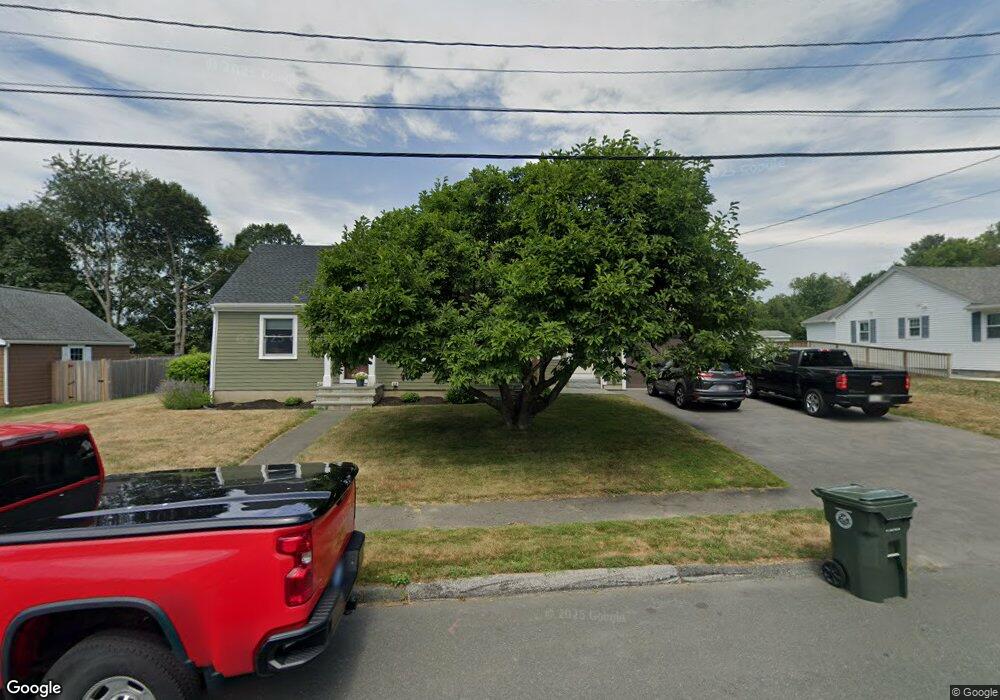
4 Bradley Rd Danvers, MA 01923
Estimated Value: $800,000 - $1,089,000
3
Beds
4
Baths
2,878
Sq Ft
$317/Sq Ft
Est. Value
About This Home
This home is located at 4 Bradley Rd, Danvers, MA 01923 and is currently estimated at $911,686, approximately $316 per square foot. 4 Bradley Rd is a home located in Essex County with nearby schools including Danvers High School, St. Mary of the Annunciation School, and North Shore Christian School.
Ownership History
Date
Name
Owned For
Owner Type
Purchase Details
Closed on
Mar 5, 2014
Sold by
Gargan Michael J and Garden Janet L
Bought by
Gargan Kevin E and Costanza Courtney
Current Estimated Value
Home Financials for this Owner
Home Financials are based on the most recent Mortgage that was taken out on this home.
Original Mortgage
$209,000
Outstanding Balance
$156,374
Interest Rate
4.39%
Mortgage Type
New Conventional
Estimated Equity
$755,312
Purchase Details
Closed on
Jul 15, 2013
Sold by
Gargan Ft and Gargan
Bought by
Gargan Michael J and Gargan Janet L
Create a Home Valuation Report for This Property
The Home Valuation Report is an in-depth analysis detailing your home's value as well as a comparison with similar homes in the area
Home Values in the Area
Average Home Value in this Area
Purchase History
| Date | Buyer | Sale Price | Title Company |
|---|---|---|---|
| Gargan Kevin E | $300,000 | -- | |
| Gargan Michael J | $310,000 | -- |
Source: Public Records
Mortgage History
| Date | Status | Borrower | Loan Amount |
|---|---|---|---|
| Open | Gargan Kevin E | $209,000 |
Source: Public Records
Tax History
| Year | Tax Paid | Tax Assessment Tax Assessment Total Assessment is a certain percentage of the fair market value that is determined by local assessors to be the total taxable value of land and additions on the property. | Land | Improvement |
|---|---|---|---|---|
| 2025 | $8,305 | $755,700 | $350,300 | $405,400 |
| 2024 | $7,110 | $640,000 | $350,300 | $289,700 |
| 2023 | $6,522 | $555,100 | $318,400 | $236,700 |
| 2022 | $6,536 | $516,300 | $288,900 | $227,400 |
| 2021 | $6,313 | $472,900 | $273,600 | $199,300 |
| 2020 | $5,889 | $450,900 | $270,400 | $180,500 |
| 2019 | $5,574 | $419,700 | $245,900 | $173,800 |
| 2018 | $5,419 | $400,200 | $243,400 | $156,800 |
| 2017 | $5,121 | $360,900 | $212,700 | $148,200 |
| 2016 | $4,925 | $346,800 | $202,800 | $144,000 |
| 2015 | $4,832 | $324,100 | $184,400 | $139,700 |
Source: Public Records
Map
Nearby Homes
- 508 Elliott St
- 59 Riverview Ave
- 2 Duck Pond Rd Unit 108
- 7 Riverbank Ave Unit 7
- 7 Riverbank Ave
- 6 Laurine Rd
- 13 Giles Ave Unit 2
- 35 Bayview Terrace Unit 7
- 147 High St
- 34 Bayview Terrace Unit 5
- 6 Mcdewell Ave Unit 4
- 11 Riverside Ave Unit 111
- 76 Water St
- 12 Adams Ave
- 55 Burley St
- 35 High St Unit 3D
- 108 Abington Rd Unit 108
- 50 Balch St Unit 205
- 123 Livingstone Ave
- 35 Locust St Unit 3
Your Personal Tour Guide
Ask me questions while you tour the home.