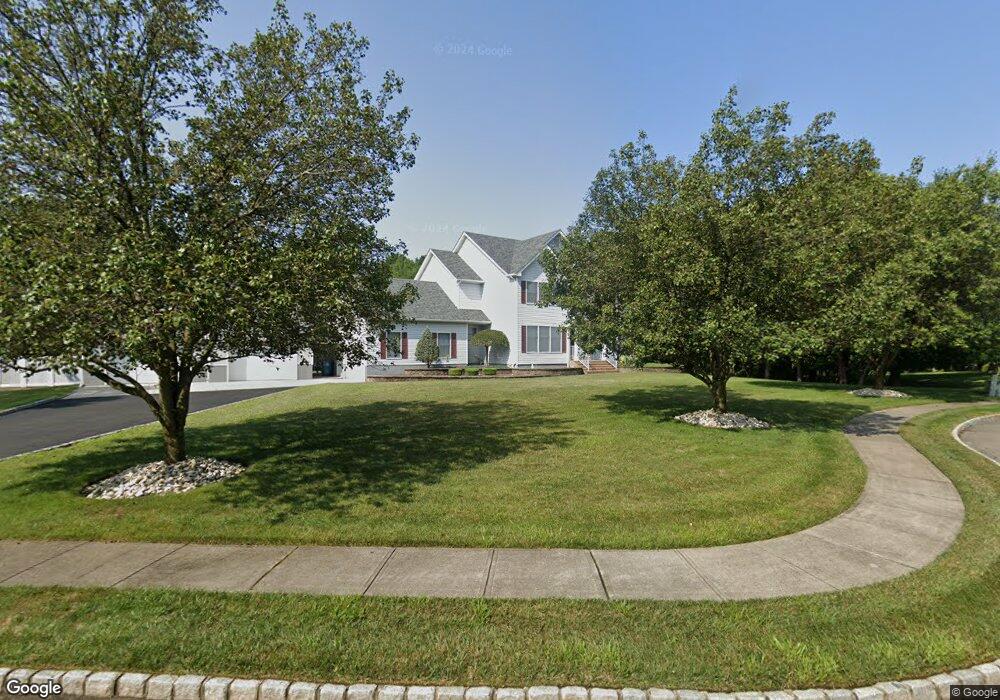
4 Brandon Ave Monroe Township, NJ 08831
Estimated Value: $996,438 - $1,120,000
--
Bed
--
Bath
2,752
Sq Ft
$383/Sq Ft
Est. Value
About This Home
This home is located at 4 Brandon Ave, Monroe Township, NJ 08831 and is currently estimated at $1,054,610, approximately $383 per square foot. 4 Brandon Ave is a home located in Middlesex County with nearby schools including Mill Lake Elementary School, Woodland Elementary School, and Monroe Township Middle School.
Ownership History
Date
Name
Owned For
Owner Type
Purchase Details
Closed on
Dec 14, 2023
Sold by
Renales Dennis and Renales Kathleen
Bought by
Renales Family Living Trust and Renales
Current Estimated Value
Purchase Details
Closed on
Nov 4, 1997
Sold by
Pines Monroe
Bought by
Renales Dennis and Renales Kathleen
Home Financials for this Owner
Home Financials are based on the most recent Mortgage that was taken out on this home.
Original Mortgage
$65,000
Interest Rate
7.17%
Create a Home Valuation Report for This Property
The Home Valuation Report is an in-depth analysis detailing your home's value as well as a comparison with similar homes in the area
Home Values in the Area
Average Home Value in this Area
Purchase History
| Date | Buyer | Sale Price | Title Company |
|---|---|---|---|
| Renales Family Living Trust | -- | None Listed On Document | |
| Renales Family Living Trust | -- | None Listed On Document | |
| Renales Dennis | $247,900 | -- |
Source: Public Records
Mortgage History
| Date | Status | Borrower | Loan Amount |
|---|---|---|---|
| Previous Owner | Renales Dennis | $65,000 |
Source: Public Records
Tax History Compared to Growth
Tax History
| Year | Tax Paid | Tax Assessment Tax Assessment Total Assessment is a certain percentage of the fair market value that is determined by local assessors to be the total taxable value of land and additions on the property. | Land | Improvement |
|---|---|---|---|---|
| 2025 | $16,626 | $595,700 | $234,600 | $361,100 |
| 2024 | $16,048 | $595,700 | $234,600 | $361,100 |
| 2023 | $16,048 | $595,700 | $234,600 | $361,100 |
| 2022 | $15,798 | $595,700 | $234,600 | $361,100 |
| 2021 | $15,715 | $595,700 | $234,600 | $361,100 |
| 2020 | $15,715 | $595,700 | $234,600 | $361,100 |
| 2019 | $15,375 | $595,700 | $234,600 | $361,100 |
| 2018 | $15,256 | $595,700 | $234,600 | $361,100 |
| 2017 | $14,958 | $595,700 | $234,600 | $361,100 |
| 2016 | $14,738 | $595,700 | $234,600 | $361,100 |
| 2015 | $14,321 | $595,700 | $234,600 | $361,100 |
| 2014 | $13,737 | $595,700 | $234,600 | $361,100 |
Source: Public Records
Map
Nearby Homes