4 Brandons Way Pepperell, MA 01463
Estimated Value: $600,000 - $664,000
3
Beds
3
Baths
2,134
Sq Ft
$299/Sq Ft
Est. Value
About This Home
This home is located at 4 Brandons Way, Pepperell, MA 01463 and is currently estimated at $638,904, approximately $299 per square foot. 4 Brandons Way is a home located in Middlesex County with nearby schools including North Middlesex Regional High School, Pepperell Christian Academy, and Maple Dene & Moppet School.
Ownership History
Date
Name
Owned For
Owner Type
Purchase Details
Closed on
Nov 2, 2015
Sold by
Nieva Thomas S and Nieva Ann M
Bought by
Ann M Nieva Ret and Nieva Thomas S
Current Estimated Value
Purchase Details
Closed on
Jan 21, 1999
Sold by
Labmik Land Corp
Bought by
Lbk Bldrs Inc and Nieva Ann M
Home Financials for this Owner
Home Financials are based on the most recent Mortgage that was taken out on this home.
Original Mortgage
$0
Interest Rate
6.83%
Mortgage Type
Purchase Money Mortgage
Create a Home Valuation Report for This Property
The Home Valuation Report is an in-depth analysis detailing your home's value as well as a comparison with similar homes in the area
Home Values in the Area
Average Home Value in this Area
Purchase History
| Date | Buyer | Sale Price | Title Company |
|---|---|---|---|
| Ann M Nieva Ret | -- | -- | |
| Lbk Bldrs Inc | $156,711 | -- |
Source: Public Records
Mortgage History
| Date | Status | Borrower | Loan Amount |
|---|---|---|---|
| Previous Owner | Lbk Bldrs Inc | $136,000 | |
| Previous Owner | Lbk Bldrs Inc | $0 |
Source: Public Records
Tax History
| Year | Tax Paid | Tax Assessment Tax Assessment Total Assessment is a certain percentage of the fair market value that is determined by local assessors to be the total taxable value of land and additions on the property. | Land | Improvement |
|---|---|---|---|---|
| 2025 | $8,474 | $579,200 | $192,500 | $386,700 |
| 2024 | $7,753 | $540,300 | $176,700 | $363,600 |
| 2023 | $7,429 | $490,700 | $150,100 | $340,600 |
| 2022 | $7,148 | $416,800 | $118,600 | $298,200 |
| 2021 | $6,922 | $386,300 | $103,400 | $282,900 |
| 2020 | $6,641 | $391,100 | $103,400 | $287,700 |
| 2019 | $8,157 | $359,800 | $103,400 | $256,400 |
| 2018 | $5,659 | $345,300 | $103,400 | $241,900 |
| 2017 | $5,331 | $335,500 | $95,800 | $239,700 |
| 2016 | $5,179 | $313,300 | $95,800 | $217,500 |
| 2015 | $4,997 | $313,300 | $95,800 | $217,500 |
| 2014 | $5,024 | $316,800 | $103,400 | $213,400 |
Source: Public Records
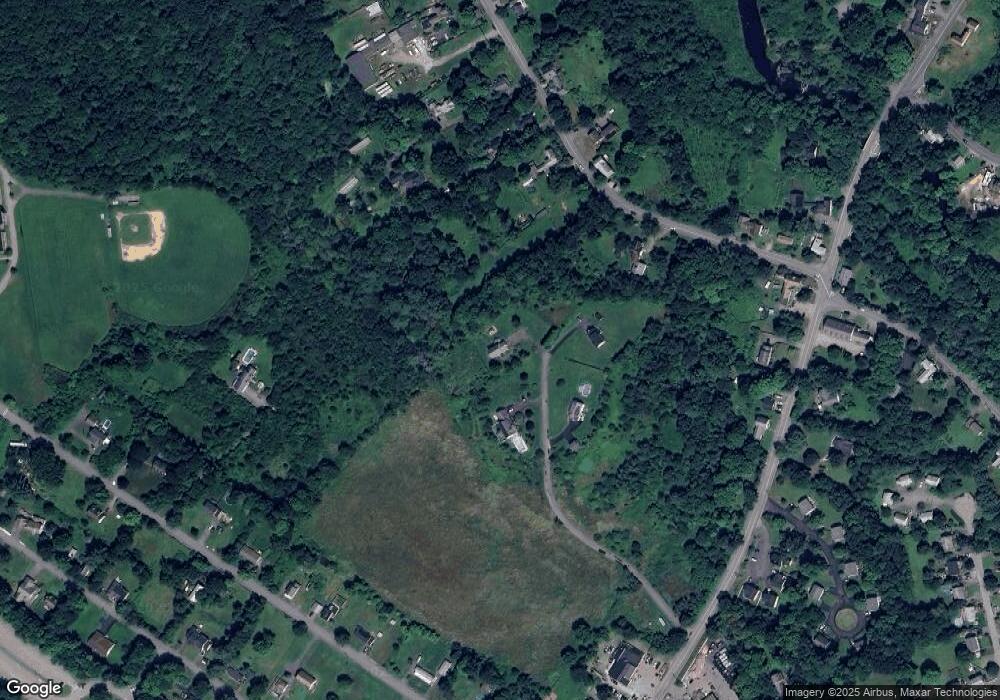
Map
Nearby Homes
- 14 Brookline St
- 39 Hollis St Unit A
- 28-30 Groton St
- 10 Bennett St
- 38 River Rd Unit 11
- 38 Tarbell St Unit 5B
- 38 Tarbell St Unit 1D
- 29 Tarbell St
- 114 Groton St
- 127 Brookline St
- 18 Maple St Unit 14
- 208 North St
- 10 Boynton St
- 39 Mount Lebanon St
- 147 Nashua Rd
- 24 Unkety Brook Way
- 109 Townsend St
- 120 Townsend St Unit 1
- 120 Townsend St Unit 2
- 179 Wyman Rd
Your Personal Tour Guide
Ask me questions while you tour the home.