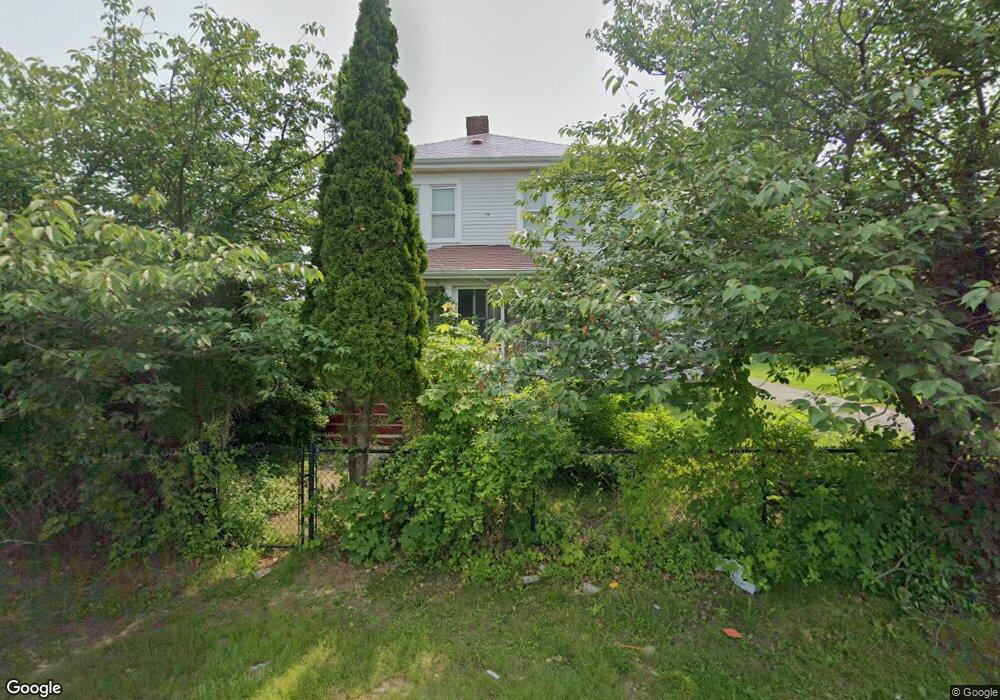
4 Breer St Brockton, MA 02301
Clifton Heights NeighborhoodEstimated Value: $492,000 - $532,000
4
Beds
2
Baths
1,604
Sq Ft
$322/Sq Ft
Est. Value
About This Home
This home is located at 4 Breer St, Brockton, MA 02301 and is currently estimated at $517,251, approximately $322 per square foot. 4 Breer St is a home located in Plymouth County with nearby schools including Gilmore Elementary School, John F. Kennedy Elementary School, and Davis K-8 School.
Ownership History
Date
Name
Owned For
Owner Type
Purchase Details
Closed on
Feb 8, 2001
Sold by
Tran Michael A
Bought by
Le Lan
Current Estimated Value
Home Financials for this Owner
Home Financials are based on the most recent Mortgage that was taken out on this home.
Original Mortgage
$115,000
Interest Rate
7.13%
Mortgage Type
Purchase Money Mortgage
Purchase Details
Closed on
Mar 9, 2000
Sold by
Anna T and Casey Joseph
Bought by
Tran Michael A
Home Financials for this Owner
Home Financials are based on the most recent Mortgage that was taken out on this home.
Original Mortgage
$54,000
Interest Rate
8.24%
Create a Home Valuation Report for This Property
The Home Valuation Report is an in-depth analysis detailing your home's value as well as a comparison with similar homes in the area
Home Values in the Area
Average Home Value in this Area
Purchase History
| Date | Buyer | Sale Price | Title Company |
|---|---|---|---|
| Le Lan | $165,000 | -- | |
| Tran Michael A | $127,500 | -- |
Source: Public Records
Mortgage History
| Date | Status | Borrower | Loan Amount |
|---|---|---|---|
| Open | Tran Michael A | $113,000 | |
| Closed | Tran Michael A | $115,000 | |
| Previous Owner | Tran Michael A | $54,000 | |
| Previous Owner | Tran Michael A | $54,000 |
Source: Public Records
Tax History Compared to Growth
Tax History
| Year | Tax Paid | Tax Assessment Tax Assessment Total Assessment is a certain percentage of the fair market value that is determined by local assessors to be the total taxable value of land and additions on the property. | Land | Improvement |
|---|---|---|---|---|
| 2025 | $5,040 | $416,200 | $151,300 | $264,900 |
| 2024 | $4,713 | $392,100 | $151,300 | $240,800 |
| 2023 | $4,845 | $373,300 | $116,700 | $256,600 |
| 2022 | $4,598 | $329,100 | $106,300 | $222,800 |
| 2021 | $4,324 | $298,200 | $99,000 | $199,200 |
| 2020 | $4,418 | $291,600 | $94,800 | $196,800 |
| 2019 | $3,222 | $273,400 | $88,700 | $184,700 |
| 2018 | $3,861 | $240,400 | $88,700 | $151,700 |
| 2017 | $2,815 | $220,400 | $88,700 | $131,700 |
| 2016 | $3,621 | $208,600 | $84,900 | $123,700 |
| 2015 | $3,176 | $175,000 | $84,900 | $90,100 |
| 2014 | $2,883 | $159,000 | $84,900 | $74,100 |
Source: Public Records
Map
Nearby Homes