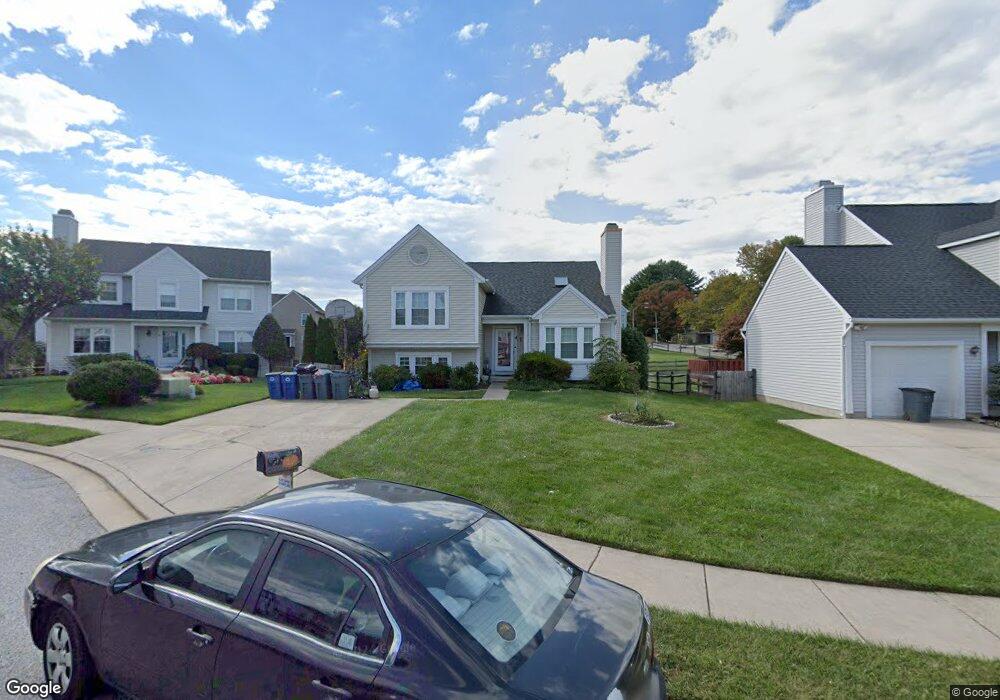
4 Brimley Ct Reisterstown, MD 21136
Estimated Value: $424,000 - $539,000
4
Beds
3
Baths
2,129
Sq Ft
$224/Sq Ft
Est. Value
About This Home
This home is located at 4 Brimley Ct, Reisterstown, MD 21136 and is currently estimated at $476,791, approximately $223 per square foot. 4 Brimley Ct is a home located in Baltimore County with nearby schools including Reisterstown Elementary, Franklin Middle, and Franklin High.
Ownership History
Date
Name
Owned For
Owner Type
Purchase Details
Closed on
Jan 12, 2005
Sold by
Thomas James
Bought by
Muller Rachel S
Current Estimated Value
Home Financials for this Owner
Home Financials are based on the most recent Mortgage that was taken out on this home.
Original Mortgage
$59,980
Outstanding Balance
$44,514
Interest Rate
5.74%
Mortgage Type
Future Advance Clause Open End Mortgage
Estimated Equity
$432,277
Purchase Details
Closed on
Dec 7, 2004
Sold by
Thomas James
Bought by
Muller Rachel S
Home Financials for this Owner
Home Financials are based on the most recent Mortgage that was taken out on this home.
Original Mortgage
$59,980
Outstanding Balance
$44,514
Interest Rate
5.74%
Mortgage Type
Future Advance Clause Open End Mortgage
Estimated Equity
$432,277
Purchase Details
Closed on
Aug 14, 2002
Sold by
Sweeney Daniel T
Bought by
Thomas James and Thomas Robin
Purchase Details
Closed on
Sep 13, 1989
Sold by
Macintosh-I Limi Ted Partnership
Bought by
Sweeney Daniel T
Create a Home Valuation Report for This Property
The Home Valuation Report is an in-depth analysis detailing your home's value as well as a comparison with similar homes in the area
Home Values in the Area
Average Home Value in this Area
Purchase History
| Date | Buyer | Sale Price | Title Company |
|---|---|---|---|
| Muller Rachel S | $293,900 | -- | |
| Muller Rachel S | $293,900 | -- | |
| Thomas James | $185,000 | -- | |
| Sweeney Daniel T | $130,600 | -- |
Source: Public Records
Mortgage History
| Date | Status | Borrower | Loan Amount |
|---|---|---|---|
| Open | Muller Rachel S | $59,980 | |
| Closed | Muller Rachel S | $59,980 |
Source: Public Records
Tax History Compared to Growth
Tax History
| Year | Tax Paid | Tax Assessment Tax Assessment Total Assessment is a certain percentage of the fair market value that is determined by local assessors to be the total taxable value of land and additions on the property. | Land | Improvement |
|---|---|---|---|---|
| 2025 | $4,878 | $340,633 | -- | -- |
| 2024 | $4,878 | $323,100 | $51,200 | $271,900 |
| 2023 | $2,424 | $307,700 | $0 | $0 |
| 2022 | $4,408 | $292,300 | $0 | $0 |
| 2021 | $4,292 | $276,900 | $51,200 | $225,700 |
| 2020 | $4,292 | $269,500 | $0 | $0 |
| 2019 | $4,109 | $262,100 | $0 | $0 |
| 2018 | $4,031 | $254,700 | $51,200 | $203,500 |
| 2017 | $4,088 | $254,700 | $0 | $0 |
| 2016 | $3,498 | $254,700 | $0 | $0 |
| 2015 | $3,498 | $258,400 | $0 | $0 |
| 2014 | $3,498 | $258,400 | $0 | $0 |
Source: Public Records
Map
Nearby Homes
- 570 Kennington Rd
- 10944 Baskerville Rd
- 611 Brickston Rd
- 7 Putman Ct
- 1 Brampton Ct
- 49 Merino Ct
- 13 Bellinger Ct
- 10 Simpson Ct
- 208 Parkholme Cir
- 237 Candytuft Rd
- 203 Cork Ln Unit T4
- 215 Greenview Ave
- 10 Wensley Dale Ct
- 4 Romney Ct
- 105 Fitz Ct Unit 202
- 101 Fitz Ct Unit 202
- 105 Fitz Ct Unit 101
- 301 Kearney Dr
- 26 Mission Wood Way
- 22 Fox Run Ct