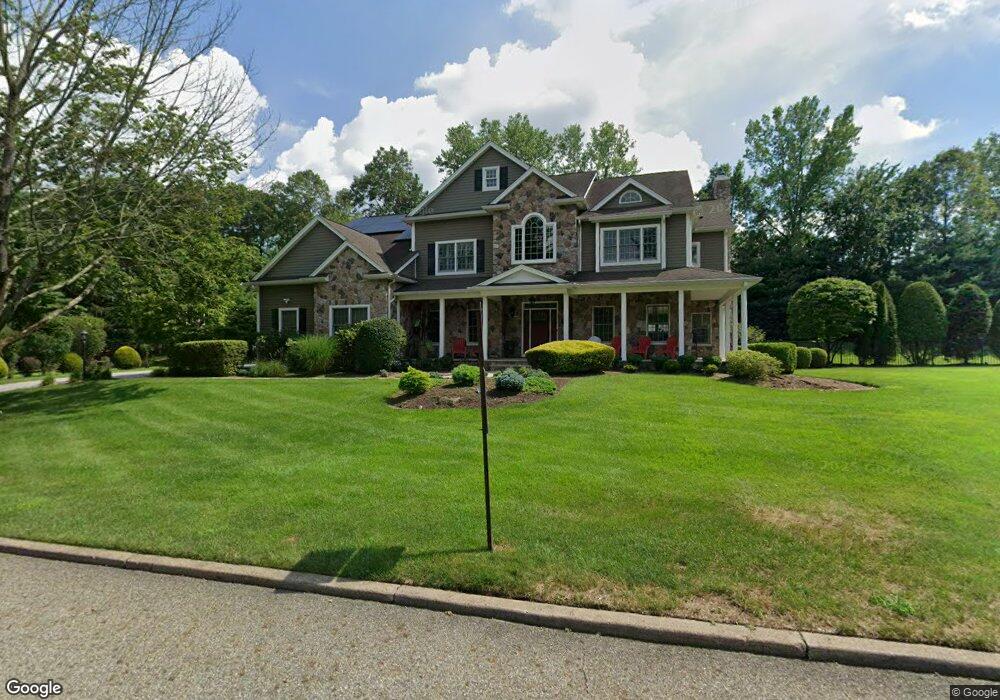
4 Brook Ct Mahwah, NJ 07430
Estimated Value: $1,697,763 - $1,822,000
5
Beds
6
Baths
4,173
Sq Ft
$421/Sq Ft
Est. Value
About This Home
This home is located at 4 Brook Ct, Mahwah, NJ 07430 and is currently estimated at $1,755,191, approximately $420 per square foot. 4 Brook Ct is a home located in Bergen County with nearby schools including Mahwah High School, Guidepost Montessori at Mahwah, and Young World Day School.
Ownership History
Date
Name
Owned For
Owner Type
Purchase Details
Closed on
Jan 24, 2020
Sold by
Ferguson Jacqueline and Jaehnert Keith
Bought by
Longo Mario P and Longo Angela
Current Estimated Value
Home Financials for this Owner
Home Financials are based on the most recent Mortgage that was taken out on this home.
Original Mortgage
$765,000
Interest Rate
3.5%
Mortgage Type
New Conventional
Purchase Details
Closed on
Aug 3, 2006
Purchase Details
Closed on
Jan 20, 2006
Sold by
Hines Carol
Bought by
Knight Ronald James and Knight Kathy
Create a Home Valuation Report for This Property
The Home Valuation Report is an in-depth analysis detailing your home's value as well as a comparison with similar homes in the area
Home Values in the Area
Average Home Value in this Area
Purchase History
| Date | Buyer | Sale Price | Title Company |
|---|---|---|---|
| Longo Mario P | $1,230,000 | All Pro Title Group Llc | |
| -- | $642,000 | -- | |
| Knight Ronald James | $615,000 | -- |
Source: Public Records
Mortgage History
| Date | Status | Borrower | Loan Amount |
|---|---|---|---|
| Previous Owner | Longo Mario P | $765,000 |
Source: Public Records
Tax History
| Year | Tax Paid | Tax Assessment Tax Assessment Total Assessment is a certain percentage of the fair market value that is determined by local assessors to be the total taxable value of land and additions on the property. | Land | Improvement |
|---|---|---|---|---|
| 2025 | $20,547 | $995,500 | $368,600 | $626,900 |
| 2024 | $20,278 | $995,500 | $368,600 | $626,900 |
| 2023 | $19,631 | $995,500 | $368,600 | $626,900 |
| 2022 | $19,631 | $995,500 | $368,600 | $626,900 |
| 2021 | $19,422 | $995,500 | $368,600 | $626,900 |
| 2020 | $18,954 | $995,500 | $368,600 | $626,900 |
| 2019 | $18,327 | $995,500 | $368,600 | $626,900 |
| 2018 | $18,068 | $995,500 | $368,600 | $626,900 |
| 2017 | $17,780 | $995,500 | $368,600 | $626,900 |
| 2016 | $17,391 | $995,500 | $368,600 | $626,900 |
| 2015 | $17,152 | $995,500 | $368,600 | $626,900 |
| 2014 | $16,864 | $995,500 | $368,600 | $626,900 |
Source: Public Records
Map
Nearby Homes
- 12 Sandburg Ct
- 5 Greene St
- 314 Meadowbrook Rd
- 89 Barrett Ln
- 573 Wyckoff Ave
- 630 Wyckoff Ave
- 53 Lockwood Dr
- 37-1 Tamaron Dr
- 4 Mill Brook Ln
- 373 W Crescent Ave
- 260 W Allendale Ave
- 8 Masterson Ct
- 16-3 Tamaron Dr
- 754 Wyckoff Ave
- 8 Crestwood Mews
- 77 Myrtle Ave
- 600 - 89 Pulis Ave Unit 89
- 128 Birch Rd
- 41 Ramsey Ave
- 79 Konight Ct
Your Personal Tour Guide
Ask me questions while you tour the home.