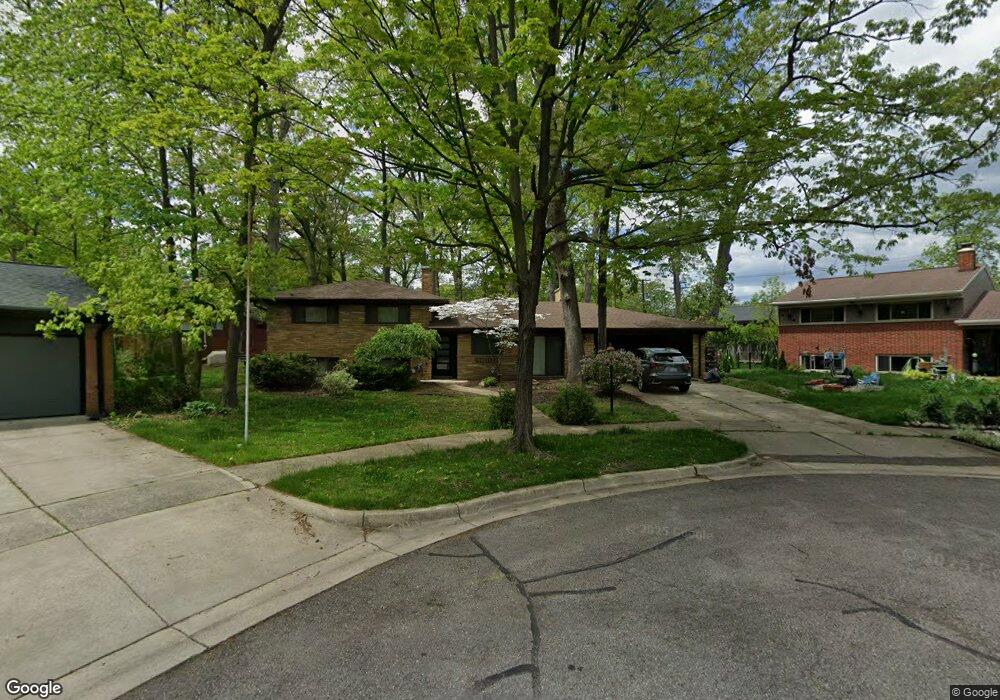
4 Buckingham Ct Unit Bldg-Unit Ann Arbor, MI 48104
Allen NeighborhoodEstimated Value: $536,000 - $664,000
3
Beds
3
Baths
1,957
Sq Ft
$301/Sq Ft
Est. Value
About This Home
This home is located at 4 Buckingham Ct Unit Bldg-Unit, Ann Arbor, MI 48104 and is currently estimated at $588,623, approximately $300 per square foot. 4 Buckingham Ct Unit Bldg-Unit is a home located in Washtenaw County with nearby schools including Pattengill Elementary School, Bryant Elementary School, and Tappan Middle School.
Ownership History
Date
Name
Owned For
Owner Type
Purchase Details
Closed on
Sep 21, 2018
Sold by
Kananen Martha J
Bought by
Kananen Martha J and The Martha Jean Kananen Living Trust
Current Estimated Value
Purchase Details
Closed on
Jul 18, 2018
Sold by
4 Buckingham Court Llc
Bought by
Kananen Martha J
Purchase Details
Closed on
Jul 10, 2018
Sold by
Renton Andrew Douglas
Bought by
4 Buckinghm Court Llc
Purchase Details
Closed on
Jul 30, 2013
Sold by
Chinn Sheryl A
Bought by
4 Buckingham Court Llc
Purchase Details
Closed on
Oct 1, 2012
Sold by
Chinn Sheryl A
Bought by
Chinn Sheryl A and Renton Andrew Douglas
Purchase Details
Closed on
Sep 28, 2012
Sold by
Smith Michael C and Smith Janet E
Bought by
Chinn Sheryl A
Create a Home Valuation Report for This Property
The Home Valuation Report is an in-depth analysis detailing your home's value as well as a comparison with similar homes in the area
Home Values in the Area
Average Home Value in this Area
Purchase History
| Date | Buyer | Sale Price | Title Company |
|---|---|---|---|
| Kananen Martha J | -- | None Available | |
| Kananen Martha J | $355,000 | First American Title Ins Co | |
| 4 Buckinghm Court Llc | -- | First American Title Co Inc | |
| 4 Buckingham Court Llc | -- | None Available | |
| Chinn Sheryl A | -- | None Available | |
| Chinn Sheryl A | $260,525 | None Available |
Source: Public Records
Tax History Compared to Growth
Tax History
| Year | Tax Paid | Tax Assessment Tax Assessment Total Assessment is a certain percentage of the fair market value that is determined by local assessors to be the total taxable value of land and additions on the property. | Land | Improvement |
|---|---|---|---|---|
| 2025 | $9,362 | $262,000 | $0 | $0 |
| 2024 | $8,718 | $235,000 | $0 | $0 |
| 2023 | $9,362 | $218,700 | $0 | $0 |
| 2022 | $7,496 | $197,300 | $0 | $0 |
| 2021 | $13,508 | $188,300 | $0 | $0 |
| 2020 | $8,305 | $173,300 | $0 | $0 |
| 2019 | $7,904 | $159,900 | $159,900 | $0 |
| 2018 | $7,440 | $150,800 | $0 | $0 |
| 2017 | $8,060 | $150,000 | $0 | $0 |
| 2016 | $7,854 | $126,929 | $0 | $0 |
| 2015 | $5,832 | $126,550 | $0 | $0 |
| 2014 | $5,832 | $108,800 | $0 | $0 |
| 2013 | -- | $108,800 | $0 | $0 |
Source: Public Records
Map
Nearby Homes
- 2125 Nature Cove Ct Unit 108
- 2219 Needham Rd
- 2115 Nature Cove Ct Unit 103
- 2115 Nature Cove Ct Unit 206
- 2236 Medford Rd
- 2106 Camelot Rd
- 2510 Manchester Rd
- 2112 Carhart Ave
- 2316 Brockman Blvd
- 2107 Ferdon Rd
- 2211 Ferdon Rd
- 2941 Kimberley Rd
- 2931 Kimberley Rd
- 2427 Londonderry Rd
- 2403 Packard St Unit 38D
- 2434 Mulberry Ct Unit 22A
- 1864 Arlington Blvd
- 2731 Canterbury Rd
- 1709 South Blvd
- 1704 Shadford Rd
- 4 Buckingham Ct
- 3 Buckingham Ct
- 2119 Needham Rd
- 5 Buckingham Ct
- 2105 Needham Rd
- 2125 Needham Rd
- 2 Buckingham Ct
- 6 Buckingham Ct
- 2139 Needham Rd
- 2411 Buckingham Rd
- 0 Buckingham Rd
- 0 Needham Rd
- 2120 Needham Rd
- 2104 Needham Rd
- 2417 Buckingham Rd
- 2400 Buckingham Rd
- 2410 Buckingham Rd
- 2132 Needham Rd
- 2311 Buckingham Rd
- 2334 Buckingham Rd