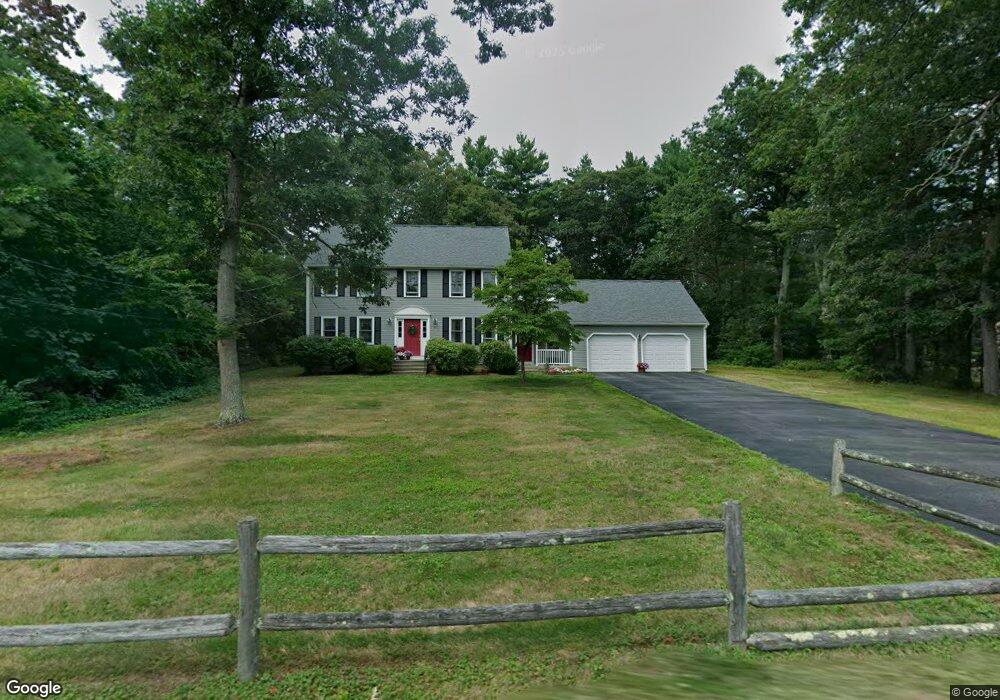
4 Bungay Rd Mansfield, MA 02048
Estimated Value: $756,000 - $831,000
4
Beds
3
Baths
2,092
Sq Ft
$378/Sq Ft
Est. Value
About This Home
This home is located at 4 Bungay Rd, Mansfield, MA 02048 and is currently estimated at $791,036, approximately $378 per square foot. 4 Bungay Rd is a home located in Bristol County with nearby schools including Everett W. Robinson Elementary School, Jordan/Jackson Elementary School, and Harold L. Qualters Middle School.
Ownership History
Date
Name
Owned For
Owner Type
Purchase Details
Closed on
Dec 11, 1990
Sold by
Whittington Richard P
Bought by
Thomson Kenneth W
Current Estimated Value
Home Financials for this Owner
Home Financials are based on the most recent Mortgage that was taken out on this home.
Original Mortgage
$80,000
Interest Rate
10.1%
Mortgage Type
Purchase Money Mortgage
Purchase Details
Closed on
Nov 18, 1987
Sold by
Broderick Corp
Bought by
Wittington Richard P
Home Financials for this Owner
Home Financials are based on the most recent Mortgage that was taken out on this home.
Original Mortgage
$151,800
Interest Rate
11.22%
Mortgage Type
Purchase Money Mortgage
Create a Home Valuation Report for This Property
The Home Valuation Report is an in-depth analysis detailing your home's value as well as a comparison with similar homes in the area
Home Values in the Area
Average Home Value in this Area
Purchase History
| Date | Buyer | Sale Price | Title Company |
|---|---|---|---|
| Thomson Kenneth W | $199,500 | -- | |
| Wittington Richard P | $209,300 | -- |
Source: Public Records
Mortgage History
| Date | Status | Borrower | Loan Amount |
|---|---|---|---|
| Closed | Wittington Richard P | $80,000 | |
| Previous Owner | Wittington Richard P | $205,000 | |
| Previous Owner | Wittington Richard P | $151,800 | |
| Previous Owner | Wittington Richard P | $75,000 |
Source: Public Records
Tax History
| Year | Tax Paid | Tax Assessment Tax Assessment Total Assessment is a certain percentage of the fair market value that is determined by local assessors to be the total taxable value of land and additions on the property. | Land | Improvement |
|---|---|---|---|---|
| 2025 | $8,456 | $642,100 | $243,800 | $398,300 |
| 2024 | $8,266 | $612,300 | $243,800 | $368,500 |
| 2023 | $7,966 | $565,400 | $243,800 | $321,600 |
| 2022 | $7,650 | $504,300 | $225,700 | $278,600 |
| 2021 | $7,619 | $496,000 | $197,500 | $298,500 |
| 2020 | $7,353 | $478,700 | $188,100 | $290,600 |
| 2019 | $6,849 | $450,000 | $156,700 | $293,300 |
| 2018 | $6,810 | $437,400 | $149,400 | $288,000 |
| 2017 | $3,242 | $425,200 | $145,200 | $280,000 |
| 2016 | $6,119 | $397,100 | $138,200 | $258,900 |
| 2015 | $5,950 | $383,900 | $138,200 | $245,700 |
Source: Public Records
Map
Nearby Homes
- 150 Gilbert St
- 24 Maverick Dr
- 14 Claire Ave
- 25 Munroe Dr
- 115 Westfield Dr
- 49 Pheasant Hill Rd
- 128 Tremont St
- 25 Shepherd St
- 57 Vine St
- 451R Gilbert St
- 84 Messenger St
- 9 Coach Rd
- 2 Oak St Unit 2B
- Lot 5 Jeffrey Dr
- Lot 2 Jeffrey Dr
- 17 Childs Ln
- 150 John L Dietsch Blvd
- 71 Richardson Ave
- 33 Colonial Way
- 28 Messenger St
Your Personal Tour Guide
Ask me questions while you tour the home.