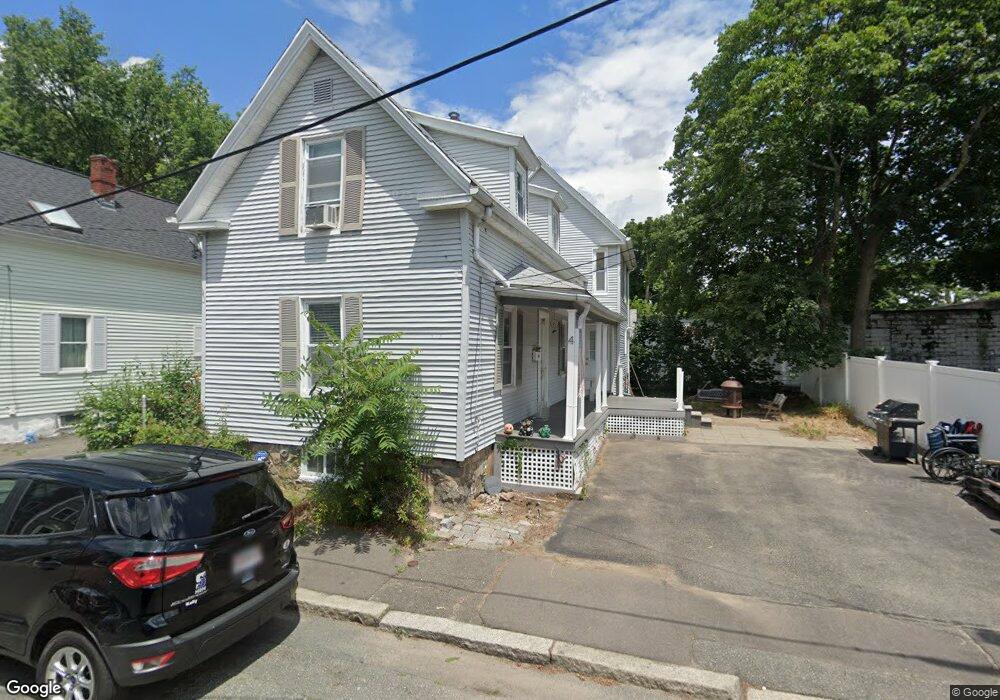
4 Burnside St Salem, MA 01970
Bridge Street NeighborhoodEstimated Value: $523,000 - $584,000
3
Beds
1
Bath
1,149
Sq Ft
$484/Sq Ft
Est. Value
About This Home
This home is located at 4 Burnside St, Salem, MA 01970 and is currently estimated at $556,189, approximately $484 per square foot. 4 Burnside St is a home located in Essex County with nearby schools including Carlton Elementary School, Saltonstall School, and Bates Elementary School.
Ownership History
Date
Name
Owned For
Owner Type
Purchase Details
Closed on
May 19, 2005
Sold by
Pagan Francisco
Bought by
Pagan Francisco
Current Estimated Value
Home Financials for this Owner
Home Financials are based on the most recent Mortgage that was taken out on this home.
Original Mortgage
$270,000
Outstanding Balance
$141,773
Interest Rate
5.95%
Mortgage Type
Purchase Money Mortgage
Estimated Equity
$414,416
Purchase Details
Closed on
Jan 14, 2004
Sold by
Nickerson Douglas B and Nickerson Tammy L
Bought by
Pagan Francisco J
Home Financials for this Owner
Home Financials are based on the most recent Mortgage that was taken out on this home.
Original Mortgage
$200,000
Interest Rate
5.98%
Mortgage Type
Purchase Money Mortgage
Purchase Details
Closed on
Feb 28, 1997
Sold by
Liversage Martha A and Mcdonald Martha A
Bought by
Pensyl Steven and Pensyl Tammy
Create a Home Valuation Report for This Property
The Home Valuation Report is an in-depth analysis detailing your home's value as well as a comparison with similar homes in the area
Home Values in the Area
Average Home Value in this Area
Purchase History
| Date | Buyer | Sale Price | Title Company |
|---|---|---|---|
| Pagan Francisco | -- | -- | |
| Pagan Francisco J | $250,000 | -- | |
| Pensyl Steven | $100,000 | -- |
Source: Public Records
Mortgage History
| Date | Status | Borrower | Loan Amount |
|---|---|---|---|
| Open | Pensyl Steven | $17,205 | |
| Open | Pensyl Steven | $270,000 | |
| Previous Owner | Pensyl Steven | $200,000 |
Source: Public Records
Tax History
| Year | Tax Paid | Tax Assessment Tax Assessment Total Assessment is a certain percentage of the fair market value that is determined by local assessors to be the total taxable value of land and additions on the property. | Land | Improvement |
|---|---|---|---|---|
| 2025 | $5,033 | $443,800 | $159,600 | $284,200 |
| 2024 | $4,858 | $418,100 | $151,200 | $266,900 |
| 2023 | $4,662 | $372,700 | $140,000 | $232,700 |
| 2022 | $4,545 | $343,000 | $131,600 | $211,400 |
| 2021 | $4,598 | $333,200 | $131,600 | $201,600 |
| 2020 | $4,276 | $295,900 | $113,700 | $182,200 |
| 2019 | $4,254 | $281,700 | $108,100 | $173,600 |
| 2018 | $4,123 | $268,100 | $103,000 | $165,100 |
| 2017 | $3,795 | $239,300 | $84,000 | $155,300 |
| 2016 | $3,679 | $234,800 | $79,500 | $155,300 |
| 2015 | $3,568 | $217,400 | $71,700 | $145,700 |
Source: Public Records
Map
Nearby Homes
- 21 Emerton St Unit 2
- 41 Dearborn St
- 31 N Washington Square Unit 3
- 17 Orchard St
- 11 Williams St Unit 2
- 17 Webb St Unit 1
- 7 Forrester St
- 8 Webb St
- 40 Essex St Unit 2
- 16 Franklin St Unit 2403
- 16 Franklin St Unit 1303
- 16 Franklin St Unit 2202
- 44 Orne St Unit 44
- 69 Essex St Unit 2
- 7 Curtis St Unit 1
- 12 Summit Ave Unit 4
- 112 North St
- 129 Essex St Unit 8
- 10.5 Herbert St Unit 21
- 131 Derby St Unit 3F
- 6 Burnside St
- 58 Bridge St Unit 2M
- 58 Bridge St Unit 1M
- 58 Bridge St
- 8-10 Burnside St
- 8 Burnside St Unit 4
- 8 Burnside St Unit 3
- 8 Burnside St Unit 2
- 8 Burnside St Unit 1
- 8 Burnside St
- 8 Burnside St Unit 10
- 5 Burnside St
- 9 Burnside St
- 60 Bridge St Unit 2
- 60 Bridge St Unit 1
- 60 Bridge St
- 7 1/2 Burnside St
- 5 March St
- 12 Burnside St
- 62 Bridge St
Your Personal Tour Guide
Ask me questions while you tour the home.