Estimated Value: $257,822 - $336,000
--
Bed
--
Bath
1,990
Sq Ft
$151/Sq Ft
Est. Value
About This Home
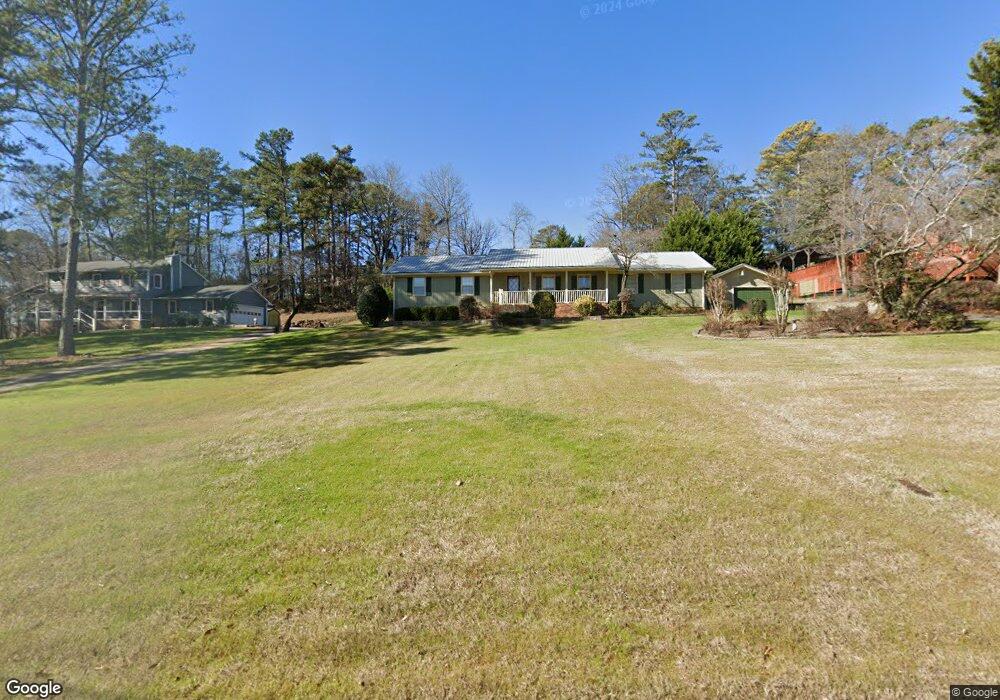
This home is located at 4 Canterbury Ct SE, Rome, GA 30161 and is currently estimated at $299,706, approximately $150 per square foot. 4 Canterbury Ct SE is a home located in Floyd County with nearby schools including Pepperell Middle School and Pepperell High School.
Ownership History
Date
Name
Owned For
Owner Type
Purchase Details
Closed on
Oct 24, 2016
Sold by
Phil D
Bought by
Coalson Taylor Phil D and Coalson Taylor Doris
Current Estimated Value
Purchase Details
Closed on
Nov 9, 1992
Sold by
Barnes John I and Barnes Laura H
Bought by
Taylor Phil D
Purchase Details
Closed on
Feb 29, 1988
Sold by
Walker Wallace Gary and Walker Kathy
Bought by
Barnes John I and Barnes Laura H
Purchase Details
Closed on
Jul 10, 1979
Sold by
Laswell Michael V and Laswell Pamela B
Bought by
Walker Wallace Gary and Walker Kathy
Purchase Details
Closed on
Sep 30, 1977
Sold by
Weaver Harley M and Weaver Margaret
Bought by
Laswell Michael V and Laswell Pamela B
Purchase Details
Closed on
May 26, 1977
Sold by
N R S Properties Inc
Bought by
Weaver Harley M and Weaver Margaret
Purchase Details
Closed on
Jun 12, 1975
Bought by
N R S Properties Inc
Create a Home Valuation Report for This Property
The Home Valuation Report is an in-depth analysis detailing your home's value as well as a comparison with similar homes in the area
Home Values in the Area
Average Home Value in this Area
Purchase History
| Date | Buyer | Sale Price | Title Company |
|---|---|---|---|
| Coalson Taylor Phil D | -- | -- | |
| Taylor Phil D | $85,000 | -- | |
| Barnes John I | $75,000 | -- | |
| Walker Wallace Gary | $52,500 | -- | |
| Laswell Michael V | $44,500 | -- | |
| Weaver Harley M | $44,000 | -- | |
| N R S Properties Inc | -- | -- |
Source: Public Records
Tax History Compared to Growth
Tax History
| Year | Tax Paid | Tax Assessment Tax Assessment Total Assessment is a certain percentage of the fair market value that is determined by local assessors to be the total taxable value of land and additions on the property. | Land | Improvement |
|---|---|---|---|---|
| 2024 | $1,735 | $100,316 | $9,914 | $90,402 |
| 2023 | $1,096 | $93,142 | $8,748 | $84,394 |
| 2022 | $1,402 | $79,090 | $6,998 | $72,092 |
| 2021 | $1,330 | $73,965 | $6,998 | $66,967 |
| 2020 | $1,203 | $66,491 | $5,540 | $60,951 |
| 2019 | $1,069 | $60,589 | $5,540 | $55,049 |
| 2018 | $1,681 | $58,591 | $5,540 | $53,051 |
| 2017 | $1,667 | $57,682 | $5,540 | $52,142 |
| 2016 | $1,679 | $57,216 | $5,520 | $51,696 |
| 2015 | $1,639 | $56,696 | $5,520 | $51,176 |
| 2014 | $1,639 | $56,696 | $5,520 | $51,176 |
Source: Public Records
Map
Nearby Homes
- 0 Warwick Way SE Unit 10624495
- 0 Warwick Way SE Unit 7666193
- 18 Devonshire Dr SE
- 85 Cambridge Dr SE
- 11 Cambridge Dr SE
- 111 Warwick Way SE
- 0 Wellington Way SE Unit 7374602
- 0 Wellington Way SE Unit 20180068
- 0 Wellington Way SE Unit 7374604
- 0 Wellington Way SE Unit 20180069
- 113 Warwick Way SE
- 9 Wellington Way SE
- 52 Twickenham Rd SE
- 0 Camelot Cir SE Unit 7662985
- 0 Camelot Cir SE Unit 10621392
- 7 Rushden Way SE
- 14 Wellington Way SE
- 3 Rushden Way SE
- 18 Wellington Way SE
- 28 Rushden Way SE
- 25 Devonshire Dr SE
- 6 Canterbury Ct SE
- 3 Downing St SE
- 5 Downing St SE
- 1 Downing St SE
- 3 Canterbury Ct SE
- 1 Canterbury Ct SE
- 7 Canterbury Ct SE Unit Studio Apartment
- 7 Canterbury Ct SE
- 5 Canterbury Ct SE
- 32 Devonshire Dr SE
- 7 Downing St SE
- 34 Devonshire Dr SE
- 30 Devonshire Dr SE
- 12 Devonshire Dr SE
- 4 Downing St SE
- 28 Devonshire Dr SE
- 2 Downing St SE
- 6 Downing St SE
- 4 Dover Dr SE