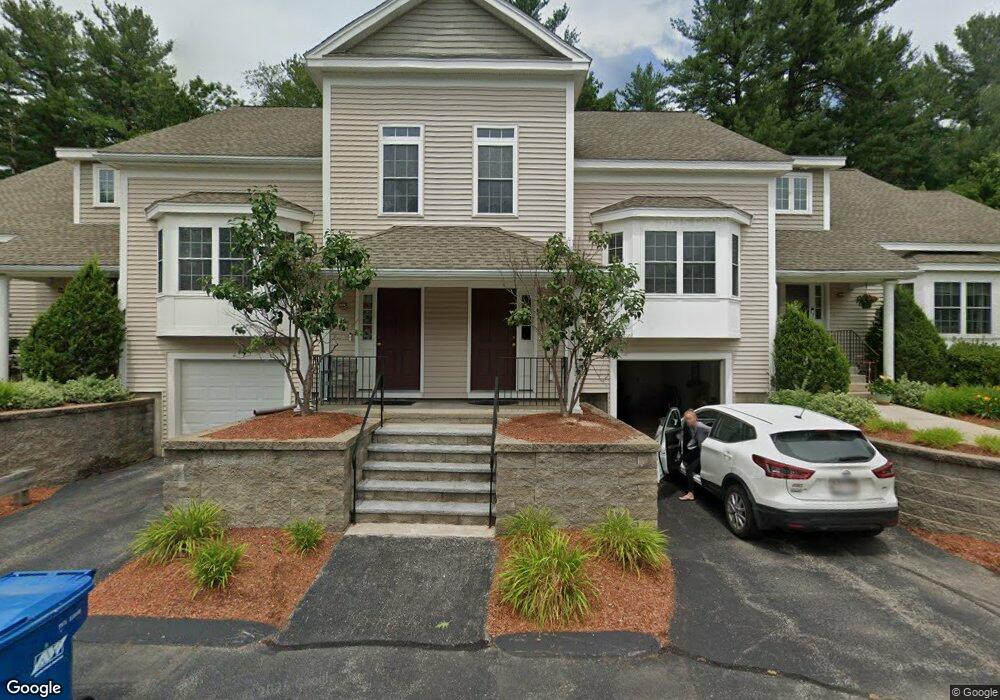
4 Charles Ridge Rd Unit B Littleton, MA 01460
Estimated Value: $577,000 - $626,000
2
Beds
3
Baths
1,808
Sq Ft
$334/Sq Ft
Est. Value
About This Home
This home is located at 4 Charles Ridge Rd Unit B, Littleton, MA 01460 and is currently estimated at $604,667, approximately $334 per square foot. 4 Charles Ridge Rd Unit B is a home located in Middlesex County with nearby schools including Shaker Lane Elementary School, Russell Street Elementary School, and Littleton Middle School.
Ownership History
Date
Name
Owned For
Owner Type
Purchase Details
Closed on
Oct 11, 2022
Sold by
Alwarsamy Premsankar and Venugopal Keerthika
Bought by
Thota Sunitha and Thota Sai Amith
Current Estimated Value
Home Financials for this Owner
Home Financials are based on the most recent Mortgage that was taken out on this home.
Original Mortgage
$475,000
Outstanding Balance
$454,660
Interest Rate
5.66%
Mortgage Type
Purchase Money Mortgage
Estimated Equity
$150,007
Purchase Details
Closed on
Dec 13, 2018
Sold by
Jimenez-Rodriguez Angela and Rodriguez Juan E
Bought by
Alwarsamy Premsankar and Venugopal Keerthika
Home Financials for this Owner
Home Financials are based on the most recent Mortgage that was taken out on this home.
Original Mortgage
$313,600
Interest Rate
4.8%
Mortgage Type
New Conventional
Purchase Details
Closed on
May 29, 2009
Sold by
Litt Ridge Ests Llc
Bought by
Jimenez Angela and Rodriguez Juan E
Create a Home Valuation Report for This Property
The Home Valuation Report is an in-depth analysis detailing your home's value as well as a comparison with similar homes in the area
Home Values in the Area
Average Home Value in this Area
Purchase History
| Date | Buyer | Sale Price | Title Company |
|---|---|---|---|
| Thota Sunitha | $500,000 | None Available | |
| Thota Sunitha | $500,000 | None Available | |
| Alwarsamy Premsankar | $392,000 | -- | |
| Alwarsamy Premsankar | $392,000 | -- | |
| Jimenez Angela | $325,000 | -- | |
| Jimenez Angela | $325,000 | -- | |
| Jimenez Angela | $325,000 | -- | |
| Jimenez Angela | $325,000 | -- |
Source: Public Records
Mortgage History
| Date | Status | Borrower | Loan Amount |
|---|---|---|---|
| Open | Thota Sunitha | $475,000 | |
| Previous Owner | Alwarsamy Premsankar | $313,600 |
Source: Public Records
Tax History Compared to Growth
Tax History
| Year | Tax Paid | Tax Assessment Tax Assessment Total Assessment is a certain percentage of the fair market value that is determined by local assessors to be the total taxable value of land and additions on the property. | Land | Improvement |
|---|---|---|---|---|
| 2025 | $71 | $477,600 | $0 | $477,600 |
| 2024 | $7,080 | $477,100 | $0 | $477,100 |
| 2023 | $7,075 | $435,400 | $0 | $435,400 |
| 2022 | $6,694 | $378,000 | $0 | $378,000 |
| 2021 | $6,620 | $374,000 | $0 | $374,000 |
| 2020 | $6,671 | $375,400 | $0 | $375,400 |
| 2019 | $6,459 | $354,100 | $0 | $354,100 |
| 2018 | $5,772 | $318,200 | $0 | $318,200 |
| 2017 | $5,507 | $303,400 | $0 | $303,400 |
| 2016 | $5,367 | $303,400 | $0 | $303,400 |
| 2015 | $5,003 | $276,400 | $0 | $276,400 |
Source: Public Records
Map
Nearby Homes
- 8 Sandy Beach Rd
- 16 Abbot St
- 66 Patten Rd
- 28 W Prescott St
- 6 Coolidge St
- 9 Elm St
- Lot 6 Noble Path
- Lot 7 Noble Path
- Lot 13 Monarch Path
- Lot 12 Monarch Path
- 36 Whitetail Way
- 9 (Lt 44) Darrell Dr
- 12 Brookfield Dr Unit A
- 12 Patten Rd
- 26 Bayberry Rd
- 10 Baldwin Hill Rd
- 41 Flagg Rd
- 125 Concord Rd
- 8 Edsel Rd
- 12 Paula Beth St
- 6 Charles Ridge Rd Unit B
- 7 Charles Ridge Rd Unit C
- 4 Charles Ridge Rd Unit D
- 1 Hannah Dodge Rd Unit 1B
- 1 Hannah Dodge Rd Unit 904
- 2 Charles Ridge Rd Unit 205
- 7 Charles Ridge Rd Unit 7C
- 1 Hannah Dodge Rd Unit 1
- 1 Charles Ridge Rd Unit 301 G1
- 4 Charles Ridge Rd Unit May 26, 201
- 7 Charles Ridge Rd Unit 704
- 8 Charles Ridge Rd Unit 802
- 7 Charles Ridge Rd Unit 7D
- 6 Charles Ridge Rd Unit 6D
- 5 Charles Ridge Rd Unit 5A
- 7 Charles Ridge Rd Unit 7A
- 5 Charles Ridge Rd Unit 5C
- 5 Charles Ridge Rd Unit 5B
- 6 Charles Ridge Rd Unit 6B
- 4 Charles Ridge Rd Unit 4B