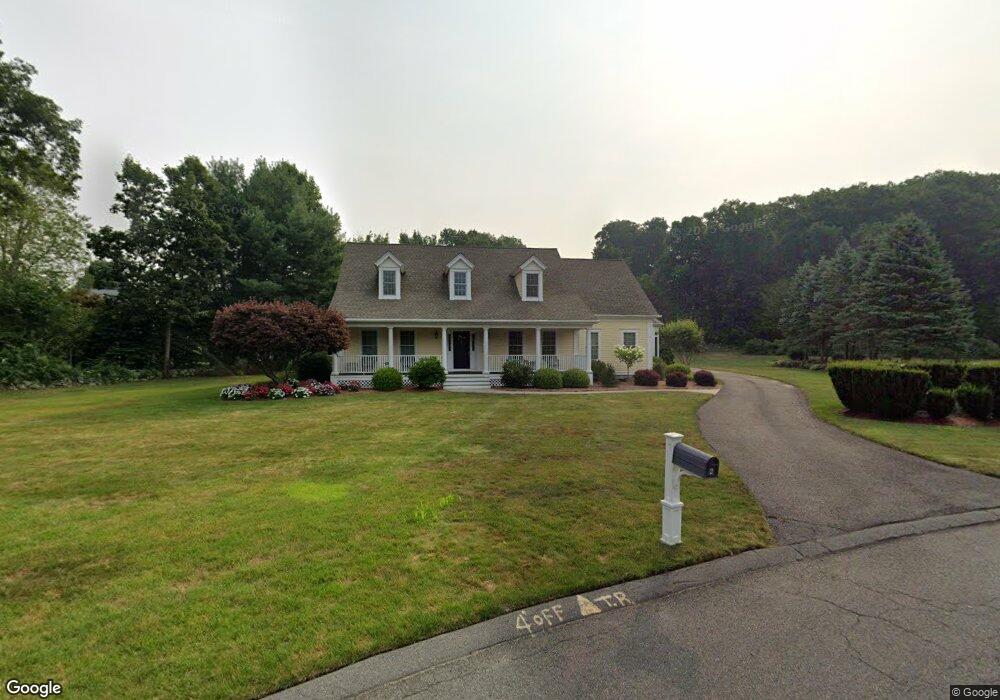
4 Chatham Trace Cir Wilbraham, MA 01095
Estimated Value: $651,000 - $982,000
4
Beds
4
Baths
3,423
Sq Ft
$239/Sq Ft
Est. Value
About This Home
This home is located at 4 Chatham Trace Cir, Wilbraham, MA 01095 and is currently estimated at $816,411, approximately $238 per square foot. 4 Chatham Trace Cir is a home located in Hampden County with nearby schools including Minnechaug Regional High School and Wilbraham & Monson Academy.
Ownership History
Date
Name
Owned For
Owner Type
Purchase Details
Closed on
Oct 24, 2000
Sold by
Kent Pecoy & Sons
Bought by
Peterson John and Peterson Maryanne
Current Estimated Value
Home Financials for this Owner
Home Financials are based on the most recent Mortgage that was taken out on this home.
Original Mortgage
$475,000
Interest Rate
7.88%
Mortgage Type
Purchase Money Mortgage
Purchase Details
Closed on
Mar 31, 1999
Sold by
Pecoy Kent W
Bought by
Kent Pecoy & Sons Cons
Create a Home Valuation Report for This Property
The Home Valuation Report is an in-depth analysis detailing your home's value as well as a comparison with similar homes in the area
Home Values in the Area
Average Home Value in this Area
Purchase History
| Date | Buyer | Sale Price | Title Company |
|---|---|---|---|
| Peterson John | $85,000 | -- | |
| Kent Pecoy & Sons Cons | $162,857 | -- |
Source: Public Records
Mortgage History
| Date | Status | Borrower | Loan Amount |
|---|---|---|---|
| Open | Kent Pecoy & Sons Cons | $360,000 | |
| Closed | Kent Pecoy & Sons Cons | $475,000 |
Source: Public Records
Tax History Compared to Growth
Tax History
| Year | Tax Paid | Tax Assessment Tax Assessment Total Assessment is a certain percentage of the fair market value that is determined by local assessors to be the total taxable value of land and additions on the property. | Land | Improvement |
|---|---|---|---|---|
| 2025 | $14,138 | $790,700 | $129,700 | $661,000 |
| 2024 | $13,013 | $703,400 | $129,700 | $573,700 |
| 2023 | $11,896 | $623,400 | $129,700 | $493,700 |
| 2022 | $11,896 | $580,600 | $129,700 | $450,900 |
| 2021 | $12,871 | $560,600 | $144,300 | $416,300 |
| 2020 | $12,546 | $560,600 | $144,300 | $416,300 |
| 2019 | $12,221 | $560,600 | $144,300 | $416,300 |
| 2018 | $11,653 | $514,700 | $144,300 | $370,400 |
| 2017 | $11,323 | $514,700 | $144,300 | $370,400 |
| 2016 | $11,200 | $518,500 | $149,100 | $369,400 |
| 2015 | $10,826 | $518,500 | $149,100 | $369,400 |
Source: Public Records
Map
Nearby Homes
- 1028 Tinkham Rd
- 6 Katie St
- 68 Monson Rd
- 230V Burleigh Rd
- 17 Peak Rd
- 6 Hilltop Park
- 19 Forest Hill Rd
- 374
- 8 Patriot Ridge Ln
- 2 Bayberry Dr Unit 51
- 12 Rose Cir
- 500 Springfield St
- 59 Baldwin Dr
- 474 Mountain Rd
- 20 Old Orchard Rd
- 28 Decorie Dr
- 27 Eastwood Dr
- 208 Tamarack Dr
- 25 Angelica Dr
- 11 Wellfleet Dr