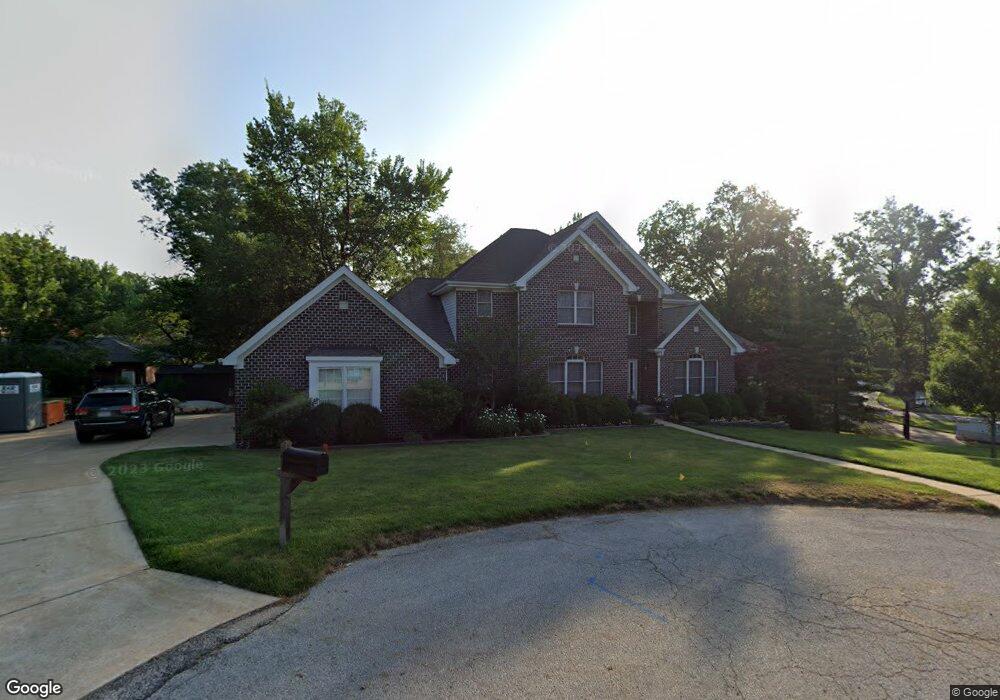
4 Cherri Ln Saint Louis, MO 63132
Estimated Value: $1,305,000 - $1,650,598
4
Beds
5
Baths
4,000
Sq Ft
$375/Sq Ft
Est. Value
About This Home
This home is located at 4 Cherri Ln, Saint Louis, MO 63132 and is currently estimated at $1,499,150, approximately $374 per square foot. 4 Cherri Ln is a home located in St. Louis County with nearby schools including Old Bonhomme Elementary School, Ladue 5th Grade Center, and Ladue Middle.
Ownership History
Date
Name
Owned For
Owner Type
Purchase Details
Closed on
Dec 31, 2009
Sold by
Centrue Bank
Bought by
Rosen Howard J and Rosen Marissa B
Current Estimated Value
Home Financials for this Owner
Home Financials are based on the most recent Mortgage that was taken out on this home.
Original Mortgage
$417,000
Outstanding Balance
$269,767
Interest Rate
4.82%
Mortgage Type
New Conventional
Estimated Equity
$1,229,383
Purchase Details
Closed on
May 5, 2009
Sold by
#4 Cherri Lane Llc
Bought by
Centrue Bank
Purchase Details
Closed on
Feb 27, 2007
Sold by
Farwig James G and Farwig Kristin A
Bought by
#4 Cherri Lane Llc
Home Financials for this Owner
Home Financials are based on the most recent Mortgage that was taken out on this home.
Original Mortgage
$799,695
Interest Rate
6.21%
Mortgage Type
Construction
Create a Home Valuation Report for This Property
The Home Valuation Report is an in-depth analysis detailing your home's value as well as a comparison with similar homes in the area
Home Values in the Area
Average Home Value in this Area
Purchase History
| Date | Buyer | Sale Price | Title Company |
|---|---|---|---|
| Rosen Howard J | $700,000 | None Available | |
| Centrue Bank | $728,613 | None Available | |
| #4 Cherri Lane Llc | $265,000 | Ort |
Source: Public Records
Mortgage History
| Date | Status | Borrower | Loan Amount |
|---|---|---|---|
| Open | Rosen Howard J | $417,000 | |
| Previous Owner | #4 Cherri Lane Llc | $799,695 |
Source: Public Records
Tax History Compared to Growth
Tax History
| Year | Tax Paid | Tax Assessment Tax Assessment Total Assessment is a certain percentage of the fair market value that is determined by local assessors to be the total taxable value of land and additions on the property. | Land | Improvement |
|---|---|---|---|---|
| 2025 | $15,844 | $235,450 | $76,670 | $158,780 |
| 2024 | $15,844 | $226,050 | $56,530 | $169,520 |
| 2023 | $15,844 | $226,050 | $56,530 | $169,520 |
| 2022 | $15,657 | $213,370 | $46,230 | $167,140 |
| 2021 | $15,564 | $213,370 | $46,230 | $167,140 |
| 2020 | $12,777 | $173,200 | $46,850 | $126,350 |
| 2019 | $12,377 | $173,200 | $46,850 | $126,350 |
| 2018 | $11,510 | $148,750 | $42,600 | $106,150 |
| 2017 | $11,469 | $148,750 | $42,600 | $106,150 |
| 2016 | $11,341 | $142,350 | $38,340 | $104,010 |
| 2015 | $10,848 | $142,350 | $38,340 | $104,010 |
| 2014 | $11,709 | $148,300 | $18,850 | $129,450 |
Source: Public Records
Map
Nearby Homes
- 12 Stacy Dr
- 17 Heather Hill Ln
- 9820 Warington Square
- 5 Downey Ln
- 4 Downey Ln
- 4 Homestead
- 9706 Mansfield Dr
- 5 Ridgegate Dr
- 740 Payson Dr
- 11 N Tealbrook Dr
- 22 Fordyce Ln
- 9501 Old Bonhomme Rd
- 9500 Old Bonhomme Rd
- 515 White Rose Ln
- 546 White Rose Ln
- 542 White Rose Ln
- 529 Long Acres
- 4 Covington Ln
- 9704 Grandview Dr
- 1 Allegro Ln
- 9 Saint Alfred Rd
- 5 Cherri Ln
- 11 Saint Alfred Rd
- 3 Cherri Ln
- 6 Cherri Ln
- 7 Saint Alfred Rd
- 14 Saint Alfred Rd
- 39 Kentom Dr
- 6 Saint Alfred Rd
- 15 Saint Alfred Rd
- 8 Saint Alfred Rd
- 16 Saint Alfred Rd
- 31 Kentom Dr
- 5 Saint Alfred Rd
- 2 Cherri Ln
- 12 Saint Alfred Rd
- 47 Kentom Dr
- 4 Saint Alfred Rd
- 7 Cherri Ln
- 10 Saint Alfred Rd