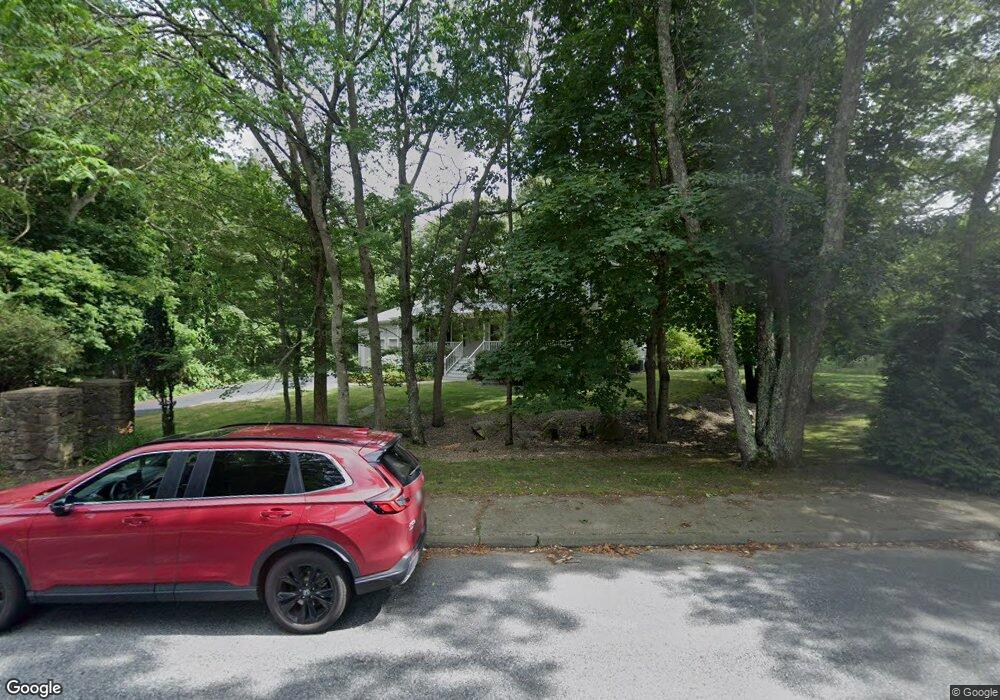
4 Chessman Dr Sharon, MA 02067
Estimated Value: $1,142,000 - $1,448,000
4
Beds
4
Baths
3,600
Sq Ft
$353/Sq Ft
Est. Value
About This Home
This home is located at 4 Chessman Dr, Sharon, MA 02067 and is currently estimated at $1,271,202, approximately $353 per square foot. 4 Chessman Dr is a home located in Norfolk County with nearby schools including East Elementary School, Sharon Middle School, and Sharon High School.
Ownership History
Date
Name
Owned For
Owner Type
Purchase Details
Closed on
Oct 28, 2009
Sold by
Keyser Leonid and Keyser Beth A
Bought by
Wang Bin and Liu Jessie Z
Current Estimated Value
Home Financials for this Owner
Home Financials are based on the most recent Mortgage that was taken out on this home.
Original Mortgage
$369,000
Outstanding Balance
$241,681
Interest Rate
5.06%
Mortgage Type
Purchase Money Mortgage
Estimated Equity
$1,029,521
Purchase Details
Closed on
Sep 10, 2007
Sold by
Faberman Brenda and Faberman Robert
Bought by
Keyser Beth A and Keyser Leonid
Home Financials for this Owner
Home Financials are based on the most recent Mortgage that was taken out on this home.
Original Mortgage
$524,000
Interest Rate
6.74%
Mortgage Type
Purchase Money Mortgage
Purchase Details
Closed on
Jul 20, 2001
Sold by
Devillis James
Bought by
Faberman Robert and Faberman Brenda
Home Financials for this Owner
Home Financials are based on the most recent Mortgage that was taken out on this home.
Original Mortgage
$439,900
Interest Rate
7.2%
Mortgage Type
Purchase Money Mortgage
Purchase Details
Closed on
Nov 26, 1997
Sold by
Jolin Corp
Bought by
Devellis James F
Home Financials for this Owner
Home Financials are based on the most recent Mortgage that was taken out on this home.
Original Mortgage
$200,000
Interest Rate
7.26%
Mortgage Type
Purchase Money Mortgage
Create a Home Valuation Report for This Property
The Home Valuation Report is an in-depth analysis detailing your home's value as well as a comparison with similar homes in the area
Home Values in the Area
Average Home Value in this Area
Purchase History
| Date | Buyer | Sale Price | Title Company |
|---|---|---|---|
| Wang Bin | $615,200 | -- | |
| Keyser Beth A | $655,000 | -- | |
| Faberman Robert | $549,900 | -- | |
| Devellis James F | $312,275 | -- |
Source: Public Records
Mortgage History
| Date | Status | Borrower | Loan Amount |
|---|---|---|---|
| Open | Wang Bin | $369,000 | |
| Previous Owner | Keyser Beth A | $524,000 | |
| Previous Owner | Devellis James F | $439,900 | |
| Previous Owner | Devellis James F | $200,000 | |
| Previous Owner | Devellis James F | $220,000 |
Source: Public Records
Tax History
| Year | Tax Paid | Tax Assessment Tax Assessment Total Assessment is a certain percentage of the fair market value that is determined by local assessors to be the total taxable value of land and additions on the property. | Land | Improvement |
|---|---|---|---|---|
| 2025 | $18,101 | $1,035,500 | $485,400 | $550,100 |
| 2024 | $17,420 | $990,900 | $445,400 | $545,500 |
| 2023 | $16,504 | $887,800 | $416,400 | $471,400 |
| 2022 | $15,741 | $797,000 | $346,900 | $450,100 |
| 2021 | $15,617 | $764,400 | $327,100 | $437,300 |
| 2020 | $14,524 | $764,400 | $327,100 | $437,300 |
| 2019 | $14,398 | $741,800 | $304,500 | $437,300 |
| 2018 | $14,256 | $736,000 | $298,700 | $437,300 |
| 2017 | $14,060 | $716,600 | $279,300 | $437,300 |
| 2016 | $13,641 | $678,300 | $279,300 | $399,000 |
| 2015 | $13,010 | $640,900 | $260,300 | $380,600 |
| 2014 | $12,030 | $585,400 | $236,700 | $348,700 |
Source: Public Records
Map
Nearby Homes
Your Personal Tour Guide
Ask me questions while you tour the home.