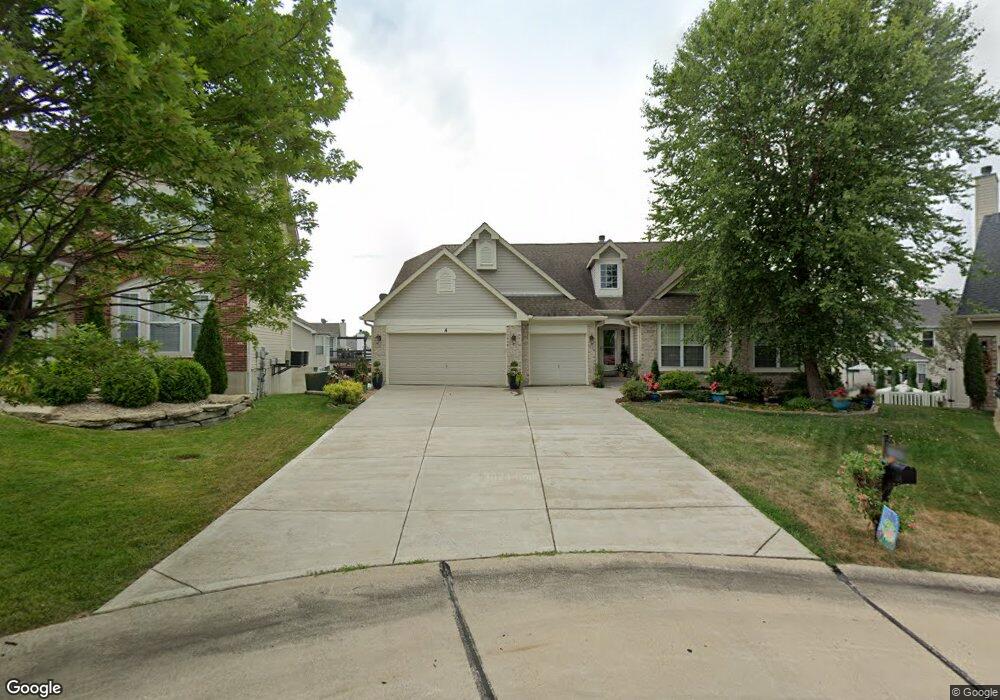
4 Chestnut Hill Ct O Fallon, MO 63368
Estimated Value: $462,168 - $517,000
4
Beds
3
Baths
2,238
Sq Ft
$218/Sq Ft
Est. Value
About This Home
This home is located at 4 Chestnut Hill Ct, O Fallon, MO 63368 and is currently estimated at $488,792, approximately $218 per square foot. 4 Chestnut Hill Ct is a home located in St. Charles County with nearby schools including Crossroads Elementary School, Frontier Middle School, and Liberty High School.
Ownership History
Date
Name
Owned For
Owner Type
Purchase Details
Closed on
Mar 29, 2011
Sold by
Hunt Daniel P and Hunt Joyce M
Bought by
Daniel P Hunt and Hunt Revocable L Joyce M
Current Estimated Value
Purchase Details
Closed on
Jul 28, 2005
Sold by
Caruso Anthony J and Caruso Karen M
Bought by
Hunt Daniel P and Hunt Joyce M
Home Financials for this Owner
Home Financials are based on the most recent Mortgage that was taken out on this home.
Original Mortgage
$254,320
Outstanding Balance
$132,307
Interest Rate
5.51%
Mortgage Type
Fannie Mae Freddie Mac
Estimated Equity
$356,485
Purchase Details
Closed on
Jun 13, 2003
Sold by
Mayer Custom Homes Inc
Bought by
Caruso Anthony J and Caruso Karen M
Home Financials for this Owner
Home Financials are based on the most recent Mortgage that was taken out on this home.
Original Mortgage
$253,500
Interest Rate
3.12%
Mortgage Type
Purchase Money Mortgage
Create a Home Valuation Report for This Property
The Home Valuation Report is an in-depth analysis detailing your home's value as well as a comparison with similar homes in the area
Home Values in the Area
Average Home Value in this Area
Purchase History
| Date | Buyer | Sale Price | Title Company |
|---|---|---|---|
| Daniel P Hunt | -- | None Available | |
| Hunt Daniel P | -- | -- | |
| Caruso Anthony J | -- | -- |
Source: Public Records
Mortgage History
| Date | Status | Borrower | Loan Amount |
|---|---|---|---|
| Open | Hunt Daniel P | $254,320 | |
| Previous Owner | Caruso Anthony J | $253,500 |
Source: Public Records
Tax History
| Year | Tax Paid | Tax Assessment Tax Assessment Total Assessment is a certain percentage of the fair market value that is determined by local assessors to be the total taxable value of land and additions on the property. | Land | Improvement |
|---|---|---|---|---|
| 2025 | $4,852 | $78,921 | -- | -- |
| 2023 | $4,856 | $70,944 | $0 | $0 |
| 2022 | $4,755 | $64,801 | $0 | $0 |
| 2021 | $4,766 | $64,801 | $0 | $0 |
| 2020 | $4,930 | $64,436 | $0 | $0 |
| 2019 | $4,628 | $64,436 | $0 | $0 |
| 2018 | $4,316 | $57,161 | $0 | $0 |
| 2017 | $4,290 | $57,161 | $0 | $0 |
| 2016 | $4,114 | $52,584 | $0 | $0 |
| 2015 | $4,053 | $52,584 | $0 | $0 |
| 2014 | $3,976 | $55,338 | $0 | $0 |
Source: Public Records
Map
Nearby Homes
- 318 Copper Tree Ct
- 3605 Post Valley Ct
- 164 Keystone Crossing Dr
- 518 Old Dominion St
- 7839 Town Square Ave
- 7817 Town Square Ave
- 160 Cedarstone Dr
- 0 Chesapeake @ Cedarstone Unit MAR24063701
- 0 Universal Design @ Cedarstone Unit MAR24063686
- 0 Bridgeport @ Cedarstone Unit MAR24063669
- 0 Braxton @ Cedarstone Unit MAR24063663
- 0 Lancaster @ Cedarstone Unit MAR24063683
- 0 Pierce @ Cedarstone Unit MAR24063672
- 0 Rosemont @ Cedarstone Unit MAR24063677
- 0 Portsmouth @ Cedarstone Unit MAR24063654
- 0 Sierra @ Cedarstone Unit MAR24063703
- 603 Hawk Run Dr
- 702 Balcarra Dr
- 120 Wake Forest Place
- 307 Newbridge Way
- 6 Chestnut Hill Ct
- 2 Chestnut Hill Ct
- 209 Chestnut Hill Dr
- 314 Copper Tree Ct
- 312 Copper Tree Ct
- 310 Copper Tree Ct
- 211 Chestnut Hill Dr
- 5 Chestnut Hill Ct
- 316 Copper Tree Ct
- 1 Chestnut Hill Ct
- 3 Chestnut Hill Ct
- 215 Chestnut Hill Dr
- 308 Copper Tree Ct
- 208 Chestnut Hill Dr
- 206 Chestnut Hill Dr
- 210 Chestnut Hill Dr
- 306 Copper Tree Ct
- 204 Chestnut Hill Dr
- 219 Chestnut Hill Dr
- 317 Copper Tree Ct
Your Personal Tour Guide
Ask me questions while you tour the home.