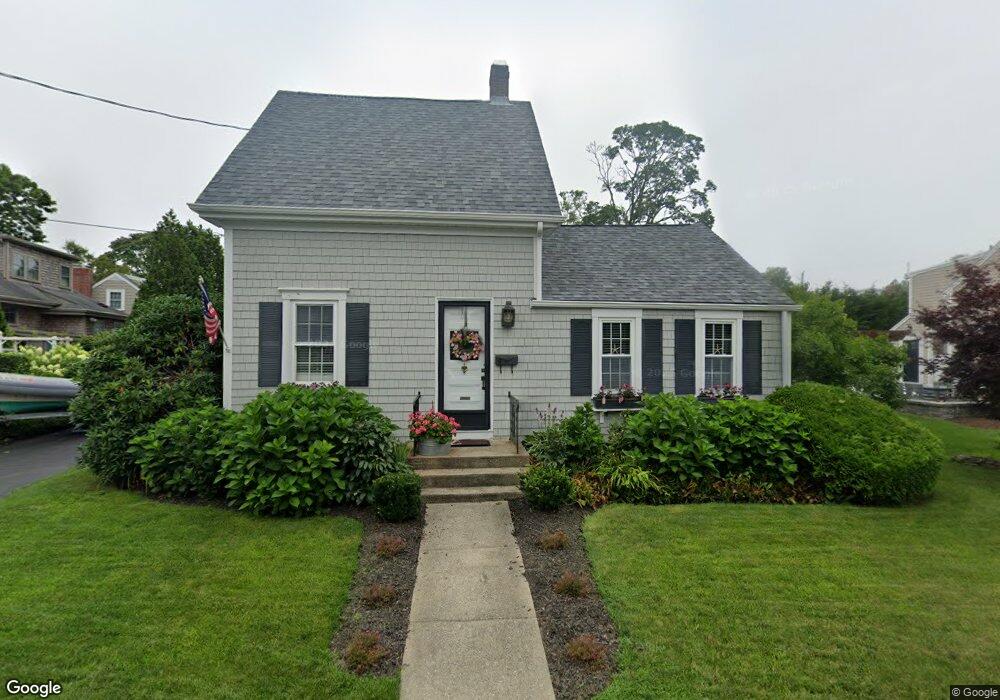
4 Chestnut St South Dartmouth, MA 02748
Dartmouth Community Park NeighborhoodEstimated Value: $485,045 - $890,000
2
Beds
1
Bath
971
Sq Ft
$645/Sq Ft
Est. Value
About This Home
This home is located at 4 Chestnut St, South Dartmouth, MA 02748 and is currently estimated at $626,011, approximately $644 per square foot. 4 Chestnut St is a home located in Bristol County with nearby schools including Dartmouth High School and St. Teresa of Calcutta School.
Ownership History
Date
Name
Owned For
Owner Type
Purchase Details
Closed on
Sep 28, 2007
Sold by
Hornaday Robyn and Hornaday William
Bought by
Revene Nancy B and Revene Thomas B
Current Estimated Value
Home Financials for this Owner
Home Financials are based on the most recent Mortgage that was taken out on this home.
Original Mortgage
$200,000
Interest Rate
6.65%
Mortgage Type
Purchase Money Mortgage
Purchase Details
Closed on
Mar 10, 2005
Sold by
Dumont M Claudette
Bought by
Lt Agreement Of Mari
Purchase Details
Closed on
May 9, 2001
Sold by
Borowicz Scott and Borowicz Alison L
Bought by
Dumont Claudette M
Purchase Details
Closed on
May 23, 2000
Sold by
Burns John R and Bair Bari L
Bought by
Wellesley Partners Llc
Purchase Details
Closed on
Feb 13, 1998
Sold by
Turner Patricia A
Bought by
Borowicz Scott and Levasseur Alison L
Create a Home Valuation Report for This Property
The Home Valuation Report is an in-depth analysis detailing your home's value as well as a comparison with similar homes in the area
Home Values in the Area
Average Home Value in this Area
Purchase History
| Date | Buyer | Sale Price | Title Company |
|---|---|---|---|
| Revene Nancy B | $305,000 | -- | |
| Lt Agreement Of Mari | -- | -- | |
| Dumont Claudette M | $185,000 | -- | |
| Wellesley Partners Llc | $327,000 | -- | |
| Borowicz Scott | $115,000 | -- |
Source: Public Records
Mortgage History
| Date | Status | Borrower | Loan Amount |
|---|---|---|---|
| Open | Borowicz Scott | $198,000 | |
| Closed | Borowicz Scott | $200,000 | |
| Previous Owner | Borowicz Scott | $234,000 |
Source: Public Records
Tax History Compared to Growth
Tax History
| Year | Tax Paid | Tax Assessment Tax Assessment Total Assessment is a certain percentage of the fair market value that is determined by local assessors to be the total taxable value of land and additions on the property. | Land | Improvement |
|---|---|---|---|---|
| 2025 | $3,452 | $400,900 | $236,700 | $164,200 |
| 2024 | $3,302 | $380,000 | $236,700 | $143,300 |
| 2023 | $3,144 | $342,900 | $210,400 | $132,500 |
| 2022 | $3,172 | $320,400 | $210,400 | $110,000 |
| 2021 | $4,514 | $281,600 | $183,800 | $97,800 |
| 2020 | $3,072 | $296,000 | $202,200 | $93,800 |
| 2019 | $2,931 | $281,800 | $193,000 | $88,800 |
| 2018 | $4,290 | $277,400 | $193,000 | $84,400 |
| 2017 | $3,862 | $271,600 | $186,000 | $85,600 |
| 2016 | $2,669 | $262,700 | $186,000 | $76,700 |
| 2015 | $2,524 | $248,900 | $171,100 | $77,800 |
| 2014 | $2,382 | $233,300 | $157,000 | $76,300 |
Source: Public Records
Map
Nearby Homes