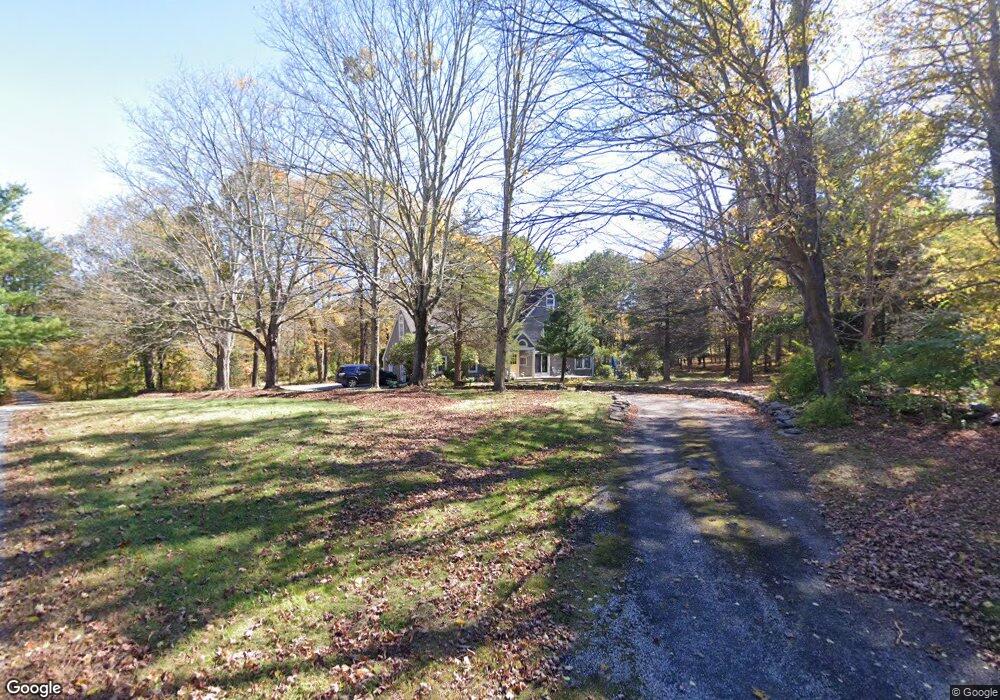
4 Chittenden Ln East Haddam, CT 06423
Estimated Value: $419,000 - $730,000
3
Beds
3
Baths
2,350
Sq Ft
$269/Sq Ft
Est. Value
About This Home
This home is located at 4 Chittenden Ln, East Haddam, CT 06423 and is currently estimated at $633,075, approximately $269 per square foot. 4 Chittenden Ln is a home located in Middlesex County with nearby schools including East Haddam Elementary School, Nathan Hale-Ray Middle School, and Nathan Hale-Ray High School.
Ownership History
Date
Name
Owned For
Owner Type
Purchase Details
Closed on
Feb 1, 2016
Sold by
Weaver Susan
Bought by
Weaver Susan and Weaver Nicole
Current Estimated Value
Home Financials for this Owner
Home Financials are based on the most recent Mortgage that was taken out on this home.
Original Mortgage
$308,400
Outstanding Balance
$245,357
Interest Rate
3.97%
Estimated Equity
$387,718
Purchase Details
Closed on
Mar 14, 2002
Sold by
Weaver Michael J and Weaver Susan M
Bought by
Durgan Peter
Create a Home Valuation Report for This Property
The Home Valuation Report is an in-depth analysis detailing your home's value as well as a comparison with similar homes in the area
Home Values in the Area
Average Home Value in this Area
Purchase History
| Date | Buyer | Sale Price | Title Company |
|---|---|---|---|
| Weaver Susan | -- | -- | |
| Durgan Peter | $140,000 | -- |
Source: Public Records
Mortgage History
| Date | Status | Borrower | Loan Amount |
|---|---|---|---|
| Open | Weaver Susan | $308,400 | |
| Previous Owner | Durgan Peter | $142,000 | |
| Previous Owner | Durgan Peter | $174,000 | |
| Previous Owner | Durgan Peter | $150,000 |
Source: Public Records
Tax History Compared to Growth
Tax History
| Year | Tax Paid | Tax Assessment Tax Assessment Total Assessment is a certain percentage of the fair market value that is determined by local assessors to be the total taxable value of land and additions on the property. | Land | Improvement |
|---|---|---|---|---|
| 2025 | $10,290 | $366,730 | $134,750 | $231,980 |
| 2024 | $9,814 | $366,730 | $134,750 | $231,980 |
| 2023 | $9,443 | $366,730 | $134,750 | $231,980 |
| 2022 | $8,621 | $271,180 | $90,650 | $180,530 |
| 2021 | $8,255 | $271,180 | $90,650 | $180,530 |
| 2020 | $8,255 | $271,180 | $90,650 | $180,530 |
| 2019 | $8,255 | $271,180 | $90,650 | $180,530 |
| 2018 | $8,043 | $271,180 | $90,650 | $180,530 |
| 2017 | $7,798 | $263,620 | $109,900 | $153,720 |
| 2016 | $7,737 | $263,620 | $109,900 | $153,720 |
| 2015 | $7,561 | $263,620 | $109,900 | $153,720 |
| 2014 | $7,355 | $263,620 | $109,900 | $153,720 |
Source: Public Records
Map
Nearby Homes