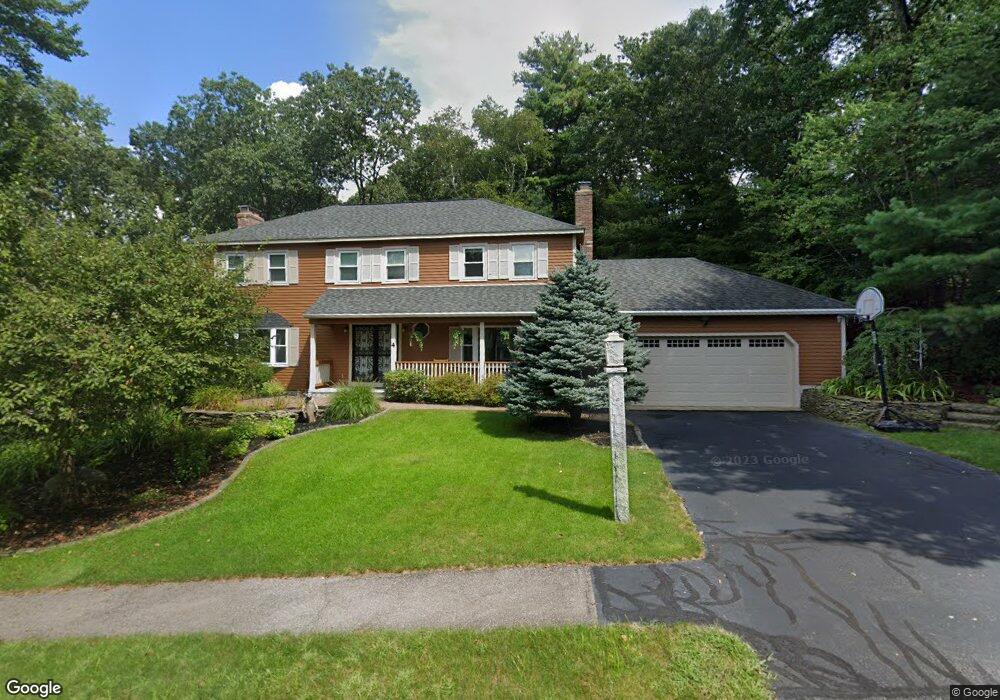
4 Clear View Dr Nashua, NH 03062
Southwest Nashua NeighborhoodEstimated Value: $709,000 - $773,000
3
Beds
4
Baths
2,431
Sq Ft
$309/Sq Ft
Est. Value
About This Home
This home is located at 4 Clear View Dr, Nashua, NH 03062 and is currently estimated at $750,970, approximately $308 per square foot. 4 Clear View Dr is a home located in Hillsborough County with nearby schools including Bicentennial Elementary School, Fairgrounds Middle School, and Nashua High School South.
Ownership History
Date
Name
Owned For
Owner Type
Purchase Details
Closed on
Feb 27, 2018
Sold by
Bradley Eileen F
Bought by
Lamina-Komba Christen and Lamina Isatta E
Current Estimated Value
Home Financials for this Owner
Home Financials are based on the most recent Mortgage that was taken out on this home.
Original Mortgage
$391,400
Outstanding Balance
$327,634
Interest Rate
3.99%
Mortgage Type
New Conventional
Estimated Equity
$423,336
Purchase Details
Closed on
Aug 11, 2014
Sold by
Bradley Eileen F
Bought by
Fordham Bandeanna and Litaker Machalla
Purchase Details
Closed on
Mar 30, 1990
Bought by
Bradley Eileen F and Fordham Vandeanna
Create a Home Valuation Report for This Property
The Home Valuation Report is an in-depth analysis detailing your home's value as well as a comparison with similar homes in the area
Home Values in the Area
Average Home Value in this Area
Purchase History
| Date | Buyer | Sale Price | Title Company |
|---|---|---|---|
| Lamina-Komba Christen | $412,000 | -- | |
| Fordham Bandeanna | -- | -- | |
| Fordham Bandeanna | -- | -- | |
| Bradley Eileen F | -- | -- |
Source: Public Records
Mortgage History
| Date | Status | Borrower | Loan Amount |
|---|---|---|---|
| Open | Lamina-Komba Christen | $391,400 |
Source: Public Records
Tax History
| Year | Tax Paid | Tax Assessment Tax Assessment Total Assessment is a certain percentage of the fair market value that is determined by local assessors to be the total taxable value of land and additions on the property. | Land | Improvement |
|---|---|---|---|---|
| 2025 | $11,670 | $693,400 | $168,900 | $524,500 |
| 2024 | $11,025 | $693,400 | $168,900 | $524,500 |
| 2023 | $10,528 | $577,500 | $135,200 | $442,300 |
| 2022 | $10,435 | $577,500 | $135,200 | $442,300 |
| 2021 | $9,676 | $416,700 | $99,100 | $317,600 |
| 2020 | $9,462 | $418,500 | $99,100 | $319,400 |
| 2019 | $9,107 | $418,500 | $99,100 | $319,400 |
| 2018 | $8,876 | $418,500 | $99,100 | $319,400 |
| 2017 | $9,171 | $355,600 | $85,500 | $270,100 |
| 2016 | $8,915 | $355,600 | $85,500 | $270,100 |
| 2015 | $8,723 | $355,600 | $85,500 | $270,100 |
| 2014 | $8,552 | $355,600 | $85,500 | $270,100 |
Source: Public Records
Map
Nearby Homes
- 16 Emerson Rd
- 8 Oakdale Ave
- 57 Timberline Dr
- 8 Collier Ct
- 70 Spindlewick Dr
- 137 Peele Rd
- 3 Appaloosa Place
- 1 Thompson Rd Unit 109
- 256 E Dunstable Rd
- 4 Chelsea Ct
- 6 Hayden St
- 17 Bicentennial Dr
- 25 Eastman St Unit 64
- 23 Eastman St
- 15 Taschereau Blvd
- 22 Taschereau Blvd
- 5 Autumn Leaf Dr Unit 16
- 397 S Main St
- 2 Doncaster Dr
- 21 Cannon Dr
Your Personal Tour Guide
Ask me questions while you tour the home.