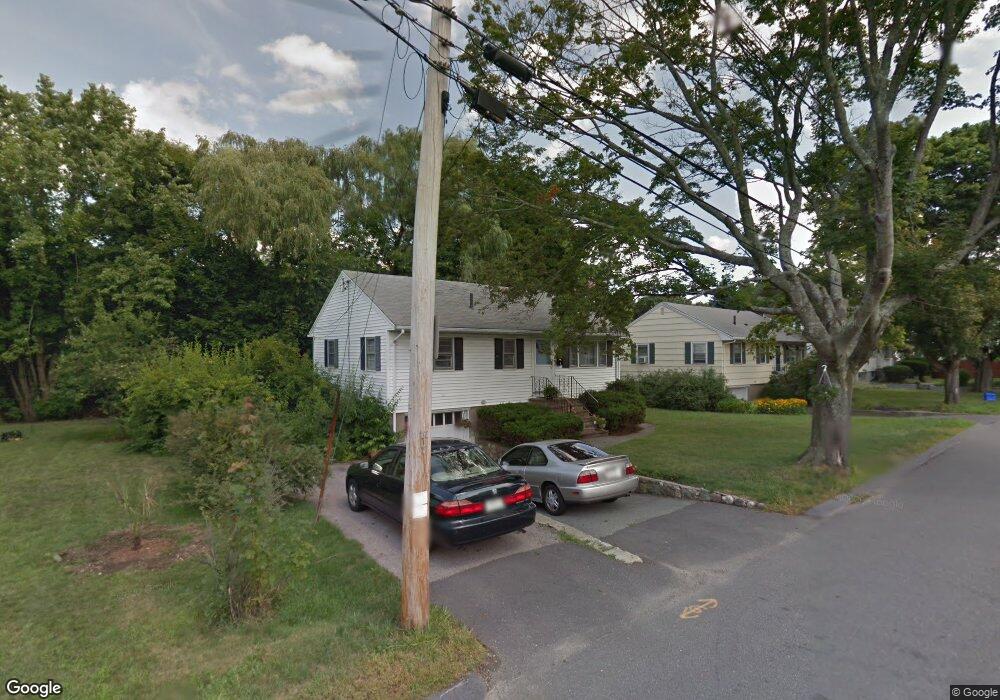
4 Clyde Terrace Arlington, MA 02474
Arlington Heights NeighborhoodEstimated Value: $654,000 - $844,000
3
Beds
2
Baths
920
Sq Ft
$843/Sq Ft
Est. Value
About This Home
This home is located at 4 Clyde Terrace, Arlington, MA 02474 and is currently estimated at $775,798, approximately $843 per square foot. 4 Clyde Terrace is a home located in Middlesex County with nearby schools including Peirce Elementary School, M. Norcross Stratton Elementary School, and Ottoson Middle School.
Ownership History
Date
Name
Owned For
Owner Type
Purchase Details
Closed on
Jan 19, 2018
Sold by
Caro Richard H and Harrington Jeanne M
Bought by
4 Clyde Terrace 2018 T and Caro
Current Estimated Value
Purchase Details
Closed on
Sep 20, 2011
Sold by
Harrington Jean M
Bought by
Caro Richard H and Harrington Jeanne M
Home Financials for this Owner
Home Financials are based on the most recent Mortgage that was taken out on this home.
Original Mortgage
$540,000
Interest Rate
4.38%
Mortgage Type
Reverse Mortgage Home Equity Conversion Mortgage
Create a Home Valuation Report for This Property
The Home Valuation Report is an in-depth analysis detailing your home's value as well as a comparison with similar homes in the area
Home Values in the Area
Average Home Value in this Area
Purchase History
| Date | Buyer | Sale Price | Title Company |
|---|---|---|---|
| 4 Clyde Terrace 2018 T | -- | -- | |
| Caro Richard H | -- | -- |
Source: Public Records
Mortgage History
| Date | Status | Borrower | Loan Amount |
|---|---|---|---|
| Previous Owner | Caro Richard H | $540,000 |
Source: Public Records
Tax History Compared to Growth
Tax History
| Year | Tax Paid | Tax Assessment Tax Assessment Total Assessment is a certain percentage of the fair market value that is determined by local assessors to be the total taxable value of land and additions on the property. | Land | Improvement |
|---|---|---|---|---|
| 2025 | $7,707 | $715,600 | $510,100 | $205,500 |
| 2024 | $7,397 | $698,500 | $503,900 | $194,600 |
| 2023 | $7,163 | $639,000 | $454,100 | $184,900 |
| 2022 | $6,842 | $599,100 | $435,500 | $163,600 |
| 2021 | $6,727 | $593,200 | $435,500 | $157,700 |
| 2020 | $6,561 | $593,200 | $435,500 | $157,700 |
| 2019 | $6,594 | $585,600 | $441,700 | $143,900 |
| 2018 | $5,745 | $473,600 | $329,700 | $143,900 |
| 2017 | $5,558 | $442,500 | $298,600 | $143,900 |
| 2016 | $5,505 | $430,100 | $286,200 | $143,900 |
| 2015 | $5,228 | $385,800 | $242,600 | $143,200 |
Source: Public Records
Map
Nearby Homes