Estimated Value: $358,222 - $417,000
6
Beds
3
Baths
2,929
Sq Ft
$131/Sq Ft
Est. Value
About This Home
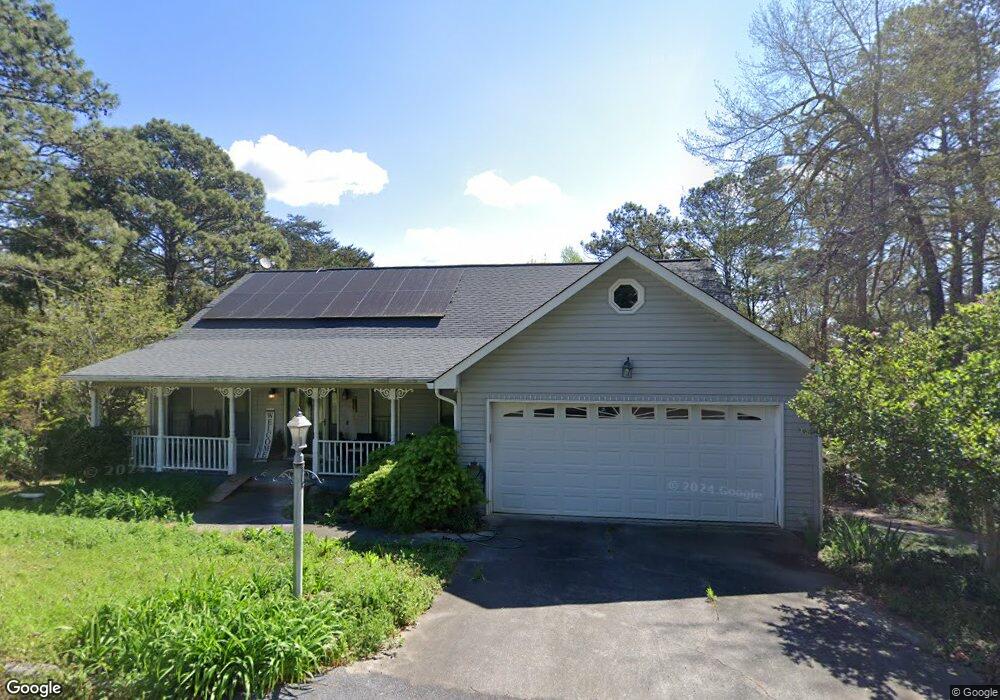
This home is located at 4 College View Dr SW, Rome, GA 30161 and is currently estimated at $383,556, approximately $130 per square foot. 4 College View Dr SW is a home located in Floyd County with nearby schools including Pepperell Middle School and Pepperell High School.
Ownership History
Date
Name
Owned For
Owner Type
Purchase Details
Closed on
Jun 19, 2020
Sold by
Wade Joseph R
Bought by
Graumlich Jeffery Steven
Current Estimated Value
Home Financials for this Owner
Home Financials are based on the most recent Mortgage that was taken out on this home.
Original Mortgage
$226,616
Outstanding Balance
$200,878
Interest Rate
3.2%
Mortgage Type
New Conventional
Estimated Equity
$182,678
Purchase Details
Closed on
Jan 26, 2012
Sold by
Heard James E
Bought by
Heard James E
Purchase Details
Closed on
Nov 15, 2005
Sold by
Smith Jerrold B
Bought by
Wade Joseph R and Wade Carol S
Purchase Details
Closed on
Dec 7, 1998
Sold by
Timms Gloria
Bought by
Smith Jerrold B and Smith Mary C
Purchase Details
Closed on
Mar 1, 1992
Sold by
Whaley Alvin R
Bought by
Timms Gloria
Purchase Details
Closed on
Oct 23, 1986
Bought by
P and R
Purchase Details
Closed on
Mar 17, 1965
Bought by
Whaley Alvin R
Create a Home Valuation Report for This Property
The Home Valuation Report is an in-depth analysis detailing your home's value as well as a comparison with similar homes in the area
Home Values in the Area
Average Home Value in this Area
Purchase History
| Date | Buyer | Sale Price | Title Company |
|---|---|---|---|
| Graumlich Jeffery Steven | $233,625 | -- | |
| Heard James E | -- | -- | |
| Wade Joseph R | $196,900 | -- | |
| Smith Jerrold B | $149,000 | -- | |
| Timms Gloria | $2,800 | -- | |
| P | -- | -- | |
| Whaley Alvin R | -- | -- |
Source: Public Records
Mortgage History
| Date | Status | Borrower | Loan Amount |
|---|---|---|---|
| Open | Graumlich Jeffery Steven | $226,616 |
Source: Public Records
Tax History Compared to Growth
Tax History
| Year | Tax Paid | Tax Assessment Tax Assessment Total Assessment is a certain percentage of the fair market value that is determined by local assessors to be the total taxable value of land and additions on the property. | Land | Improvement |
|---|---|---|---|---|
| 2024 | $3,992 | $130,552 | $6,518 | $124,034 |
| 2023 | $3,735 | $126,490 | $5,794 | $120,696 |
| 2022 | $3,161 | $106,535 | $4,707 | $101,828 |
| 2021 | $2,933 | $97,160 | $4,707 | $92,453 |
| 2020 | $1,580 | $77,912 | $3,621 | $74,291 |
| 2019 | $1,447 | $74,427 | $3,621 | $70,806 |
| 2018 | $2,036 | $70,861 | $3,621 | $67,240 |
| 2017 | $1,983 | $68,965 | $3,621 | $65,344 |
| 2016 | $1,975 | $67,908 | $3,600 | $64,308 |
| 2015 | $1,920 | $65,748 | $3,600 | $62,148 |
| 2014 | $1,920 | $65,748 | $3,600 | $62,148 |
Source: Public Records
Map
Nearby Homes
- 0 College View Dr SW Unit 7648701
- 0 College View Dr SW Unit 7645215
- 0 College View Dr SW Unit 20148725
- 0 College View Dr SW Unit 20148724
- 0 Vanns Valley Rd SW Unit 10534224
- 0 Vanns Valley Rd SW Unit 7589183
- 65 Vanns Valley Rd SW
- 3667 Cave Spring Rd SW
- 514 Booze Mountain Rd SE
- 185 Marion Dairy Rd SE
- 3904 Cave Spring Rd SW
- 26 The Trail SE
- 184 Conns Lake Extension
- 0 Booze Mountain Rd Unit 10580353
- 407 Blackberry Ln SE
- 81 Hughes Dairy Rd
- 1380 Old Cedartown Rd SE
- 608 Eden Valley Rd SE
- 0 Walker Mountain Rd SW Unit 10531001
- 0 Walker Mountain Rd SW Unit 7551047
- 22 College Park Dr SW
- 0 College View Dr SW Unit 8303050
- 0 College View Dr SW Unit 8040206
- 0 College View Dr SW Unit 7645207
- 0 College View Dr SW Unit 7391973
- 0 College View Dr SW Unit 7391966
- 0 College View Dr SW Unit 7280980
- 0 College View Dr SW Unit 7280972
- 0 College View Dr SW Unit 7152432
- 0 College View Dr SW Unit 10115548
- 0 College View Dr SW Unit 8771598
- 0 College View Dr SW Unit 3251007
- 0 College View Dr SW Unit 7093195
- 0 College View Dr SW Unit 8430967
- 0 College View Dr SW Unit 8545946
- 0 College View Dr SW Unit 8629033
- 8 College View Dr SW
- 7 College View Dr SW
- 1 College View Dr SW
- 1 College View Dr SW