Estimated Value: $1,227,000 - $1,450,000
4
Beds
3
Baths
2,760
Sq Ft
$478/Sq Ft
Est. Value
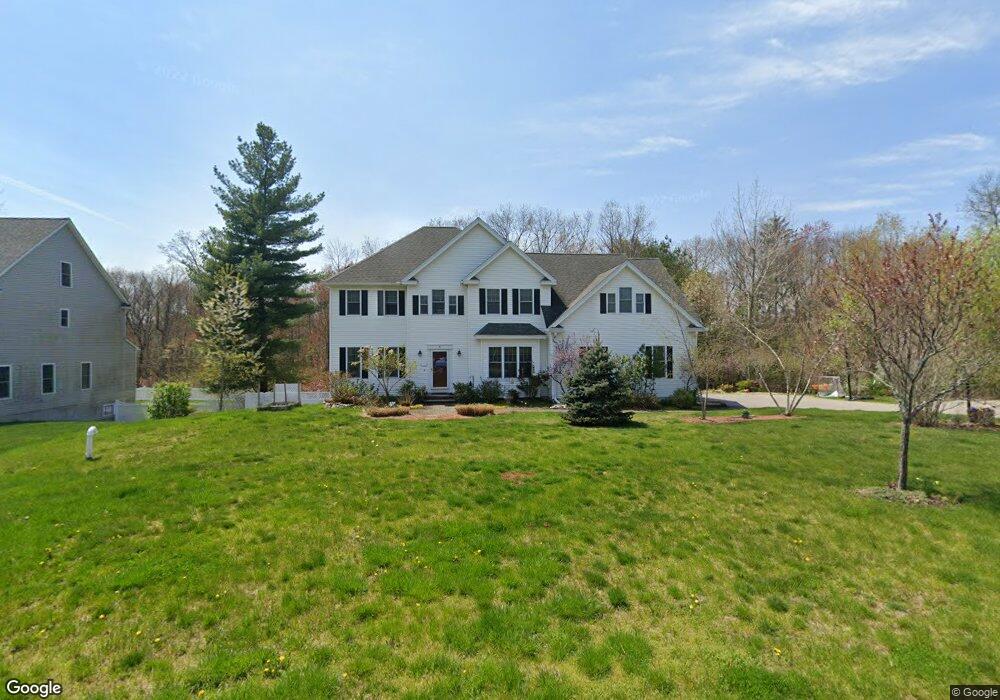
About This Home
This home is located at 4 Colonial Path, Acton, MA 01720 and is currently estimated at $1,318,791, approximately $477 per square foot. 4 Colonial Path is a home located in Middlesex County with nearby schools including Acton-Boxborough Regional High School, Maynard Knowledge Beginnings, and The Imago School.
Ownership History
Date
Name
Owned For
Owner Type
Purchase Details
Closed on
Dec 16, 2024
Sold by
Hoitt James F and Hoitt Kathleen M
Bought by
2024 Hoitt Ft and Hoitt
Current Estimated Value
Purchase Details
Closed on
Oct 5, 2007
Sold by
Colonial Path Llc
Bought by
Hoitt James F and Hoitt Kathleen M
Create a Home Valuation Report for This Property
The Home Valuation Report is an in-depth analysis detailing your home's value as well as a comparison with similar homes in the area
Home Values in the Area
Average Home Value in this Area
Purchase History
| Date | Buyer | Sale Price | Title Company |
|---|---|---|---|
| 2024 Hoitt Ft | -- | None Available | |
| 2024 Hoitt Ft | -- | None Available | |
| Hoitt James F | $747,135 | -- | |
| Hoitt James F | $747,135 | -- |
Source: Public Records
Mortgage History
| Date | Status | Borrower | Loan Amount |
|---|---|---|---|
| Previous Owner | Hoitt James F | $408,000 | |
| Previous Owner | Hoitt James F | $160,000 | |
| Previous Owner | Hoitt James F | $417,000 |
Source: Public Records
Tax History
| Year | Tax Paid | Tax Assessment Tax Assessment Total Assessment is a certain percentage of the fair market value that is determined by local assessors to be the total taxable value of land and additions on the property. | Land | Improvement |
|---|---|---|---|---|
| 2025 | $20,597 | $1,201,000 | $313,900 | $887,100 |
| 2024 | $19,090 | $1,145,200 | $313,900 | $831,300 |
| 2023 | $18,707 | $1,065,300 | $285,400 | $779,900 |
| 2022 | $17,801 | $915,200 | $248,100 | $667,100 |
| 2021 | $17,440 | $862,100 | $229,700 | $632,400 |
| 2020 | $16,419 | $853,400 | $229,700 | $623,700 |
| 2019 | $15,769 | $814,100 | $229,700 | $584,400 |
| 2018 | $15,549 | $802,300 | $229,700 | $572,600 |
| 2017 | $14,522 | $761,900 | $229,700 | $532,200 |
| 2016 | $14,117 | $734,100 | $229,700 | $504,400 |
| 2015 | $13,817 | $725,300 | $229,700 | $495,600 |
| 2014 | $12,679 | $651,900 | $199,800 | $452,100 |
Source: Public Records
Map
Nearby Homes
- 40 High St
- 131 Main St
- 129 Main St Unit 129
- 71 Liberty St
- 25 Nylander Way
- 30 Brewster Ln
- 63 Conant St
- 70 River St
- 184 Main St Unit 3
- 1 Vanderbelt Rd
- 36 Brown St
- 7 Hillcrest Dr
- 12 Brown St
- 128 Parker St Unit 3B
- 7 Kelley Rd
- 1 Drummer Rd Unit A5
- 246 Main St Unit 2
- 31 Drummer Rd Unit 31
- 153 Summer St
- 70 Powder Mill Rd
Your Personal Tour Guide
Ask me questions while you tour the home.