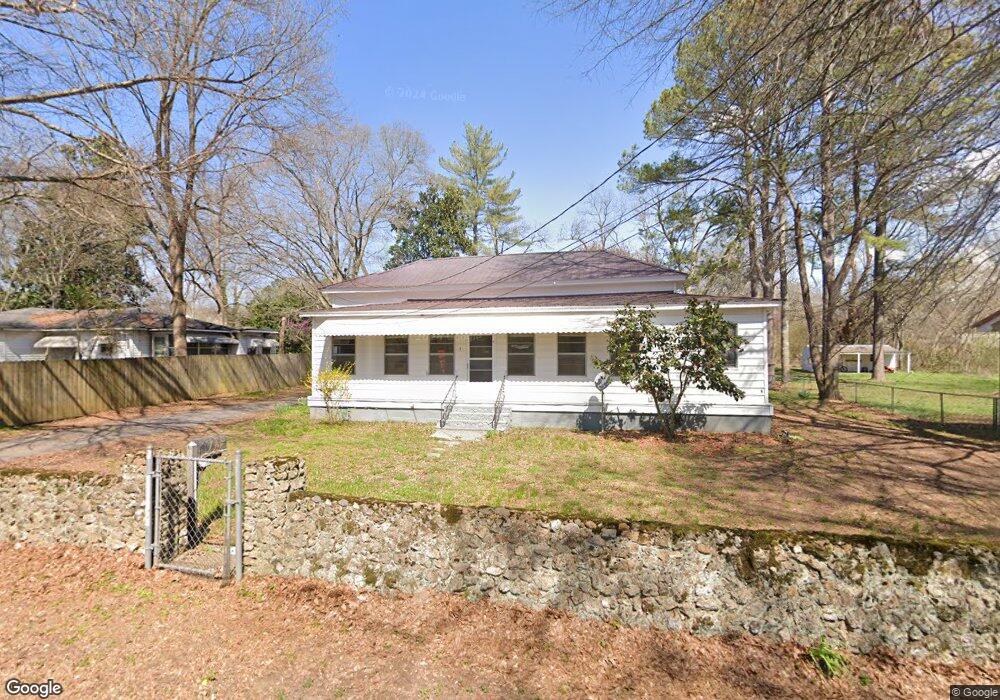
4 Craven St SW Cave Spring, GA 30124
Estimated Value: $190,792 - $270,000
2
Beds
2
Baths
1,739
Sq Ft
$122/Sq Ft
Est. Value
About This Home
This home is located at 4 Craven St SW, Cave Spring, GA 30124 and is currently estimated at $211,948, approximately $121 per square foot. 4 Craven St SW is a home located in Floyd County with nearby schools including Coosa Middle School and Coosa High School.
Ownership History
Date
Name
Owned For
Owner Type
Purchase Details
Closed on
Jun 20, 2023
Sold by
Wimpey Patsy B
Bought by
Reeder Parker and Reeder Avery
Current Estimated Value
Home Financials for this Owner
Home Financials are based on the most recent Mortgage that was taken out on this home.
Original Mortgage
$147,283
Outstanding Balance
$143,493
Interest Rate
6.6%
Mortgage Type
FHA
Estimated Equity
$68,455
Purchase Details
Closed on
Jul 8, 2022
Sold by
White Kathleen E
Bought by
Wimpey Patsy B
Home Financials for this Owner
Home Financials are based on the most recent Mortgage that was taken out on this home.
Original Mortgage
$111,920
Interest Rate
5.23%
Mortgage Type
New Conventional
Purchase Details
Closed on
Jul 31, 1997
Sold by
Pope Phillip W and Pope Betty J
Bought by
White Kathleen E
Purchase Details
Closed on
Mar 21, 1994
Sold by
Mize Gladys Latham
Bought by
Pope Phillip W and Pope Betty J
Purchase Details
Closed on
Jan 1, 1970
Sold by
Latham J T
Bought by
Mize Gladys Latham
Purchase Details
Closed on
Jan 1, 1928
Bought by
Latham J T
Create a Home Valuation Report for This Property
The Home Valuation Report is an in-depth analysis detailing your home's value as well as a comparison with similar homes in the area
Home Values in the Area
Average Home Value in this Area
Purchase History
| Date | Buyer | Sale Price | Title Company |
|---|---|---|---|
| Reeder Parker | $150,000 | -- | |
| Wimpey Patsy B | $139,900 | -- | |
| White Kathleen E | $57,700 | -- | |
| Pope Phillip W | $31,000 | -- | |
| Mize Gladys Latham | -- | -- | |
| Latham J T | -- | -- |
Source: Public Records
Mortgage History
| Date | Status | Borrower | Loan Amount |
|---|---|---|---|
| Open | Reeder Parker | $147,283 | |
| Previous Owner | Wimpey Patsy B | $111,920 |
Source: Public Records
Tax History Compared to Growth
Tax History
| Year | Tax Paid | Tax Assessment Tax Assessment Total Assessment is a certain percentage of the fair market value that is determined by local assessors to be the total taxable value of land and additions on the property. | Land | Improvement |
|---|---|---|---|---|
| 2024 | $1,894 | $74,999 | $4,520 | $70,479 |
| 2023 | $1,498 | $77,247 | $4,109 | $73,138 |
| 2022 | $1,297 | $47,382 | $3,287 | $44,095 |
| 2021 | $1,115 | $39,997 | $3,287 | $36,710 |
| 2020 | $1,042 | $37,033 | $2,465 | $34,568 |
| 2019 | $968 | $34,922 | $2,465 | $32,457 |
| 2018 | $911 | $32,780 | $2,465 | $30,315 |
| 2017 | $878 | $31,526 | $2,465 | $29,061 |
| 2016 | $838 | $29,741 | $2,440 | $27,301 |
| 2015 | $686 | $29,741 | $2,440 | $27,301 |
| 2014 | $686 | $29,741 | $2,440 | $27,301 |
Source: Public Records
Map
Nearby Homes
- 10,12,14 & 16 Park St
- 12 Park St
- 4 Church St
- 22 River St SW
- 7 Herschel Mize Dr
- 7 Herschel Mize Dr SW
- 6 River St SW
- 1 Heather Cir
- 7231 Cave Springs Rd
- 79 Mill St SW
- 5549 Fosters Mill Rd SW
- 10 Ridge Rd SW
- 0 Jackson Chapel Rd SW Unit 23799655
- 907 Gadsden Rd SW
- 4720 Fosters Mill Rd SW
- 900 Chubb Rd
- 123 Santa Claus Rd
- 424 Michael Blvd
- 251 Valley Grove Rd
- 244 Valley Grove Rd