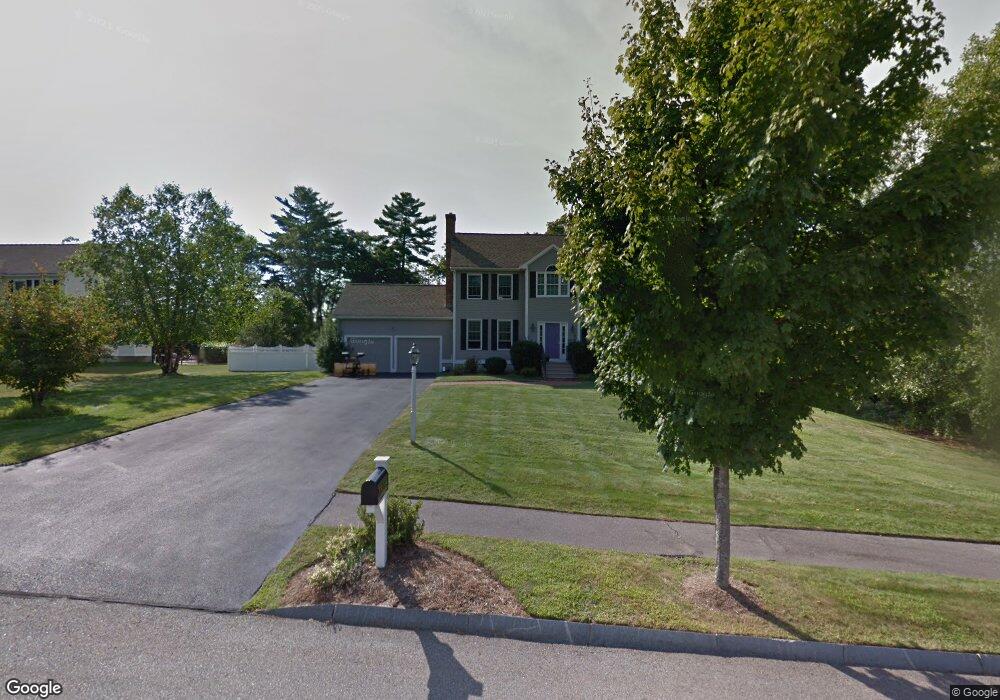
4 Cressbrook Norfolk, MA 02056
Estimated Value: $860,050 - $1,039,000
3
Beds
3
Baths
2,350
Sq Ft
$399/Sq Ft
Est. Value
About This Home
This home is located at 4 Cressbrook, Norfolk, MA 02056 and is currently estimated at $938,013, approximately $399 per square foot. 4 Cressbrook is a home located in Norfolk County with nearby schools including H. Olive Day School, Freeman-Kennedy School, and Woodside Montessori Academy.
Ownership History
Date
Name
Owned For
Owner Type
Purchase Details
Closed on
Dec 19, 2019
Sold by
Fabiano Patricia L Est
Bought by
Rubiere Alphonso and Rubiere Lina M
Current Estimated Value
Home Financials for this Owner
Home Financials are based on the most recent Mortgage that was taken out on this home.
Original Mortgage
$456,800
Outstanding Balance
$402,735
Interest Rate
3.6%
Mortgage Type
New Conventional
Estimated Equity
$535,278
Purchase Details
Closed on
Apr 29, 2005
Sold by
Mahoney Kenna A and Reinhardt Kenna A
Bought by
Fabiano Patricia
Purchase Details
Closed on
Sep 30, 1999
Sold by
Medfield Ent Inc
Bought by
Reinhardt Mark
Home Financials for this Owner
Home Financials are based on the most recent Mortgage that was taken out on this home.
Original Mortgage
$266,175
Interest Rate
7.85%
Mortgage Type
Purchase Money Mortgage
Create a Home Valuation Report for This Property
The Home Valuation Report is an in-depth analysis detailing your home's value as well as a comparison with similar homes in the area
Home Values in the Area
Average Home Value in this Area
Purchase History
| Date | Buyer | Sale Price | Title Company |
|---|---|---|---|
| Rubiere Alphonso | $571,000 | None Available | |
| Fabiano Patricia | $585,000 | -- | |
| Reinhardt Mark | $354,900 | -- |
Source: Public Records
Mortgage History
| Date | Status | Borrower | Loan Amount |
|---|---|---|---|
| Open | Rubiere Alphonso | $456,800 | |
| Previous Owner | Reinhardt Mark | $300,000 | |
| Previous Owner | Reinhardt Mark | $266,175 | |
| Closed | Reinhardt Mark | $38,750 |
Source: Public Records
Tax History
| Year | Tax Paid | Tax Assessment Tax Assessment Total Assessment is a certain percentage of the fair market value that is determined by local assessors to be the total taxable value of land and additions on the property. | Land | Improvement |
|---|---|---|---|---|
| 2025 | $11,712 | $733,400 | $213,500 | $519,900 |
| 2024 | $11,030 | $708,400 | $213,500 | $494,900 |
| 2023 | $10,547 | $642,700 | $213,500 | $429,200 |
| 2022 | $9,986 | $548,700 | $200,000 | $348,700 |
| 2021 | $9,653 | $536,600 | $194,300 | $342,300 |
| 2020 | $9,825 | $527,100 | $176,600 | $350,500 |
| 2019 | $9,450 | $516,700 | $176,600 | $340,100 |
| 2018 | $9,038 | $485,400 | $176,600 | $308,800 |
| 2017 | $8,910 | $489,000 | $176,600 | $312,400 |
| 2016 | $8,727 | $482,700 | $176,600 | $306,100 |
| 2015 | $8,434 | $477,600 | $168,100 | $309,500 |
| 2014 | $8,257 | $473,700 | $168,100 | $305,600 |
Source: Public Records
Map
Nearby Homes
- 40 Medway St
- 18 Keeney Pond Rd
- 7 Keeney Pond Rd
- 45 Meetinghouse Rd Unit 45
- 6 Trailside Way
- 3 Elliot Mills Unit 2
- 6 Elliot Mills Unit 31
- 118 Main St
- 98 Medway St
- 7 Old Colony Dr
- 41 Myrtle St
- 12 Ariana Ln
- 1 Margauxs Way
- 28 Waites Crossing
- 22 Waites Crossing
- 9 Waites Crossing
- 25 King St
- 56 Leland Rd
- 12 Brookside Ln
- 37 Thomas Mann Cir Unit 23
Your Personal Tour Guide
Ask me questions while you tour the home.